mirror of
https://github.com/clearml/clearml-docs
synced 2025-06-26 18:17:44 +00:00
1.7 KiB
1.7 KiB
| title |
|---|
| 3D Plots Reporting |
The 3d_plots_reporting.py example demonstrates reporting a series as a surface plot and as a 3D scatter plot.
When the script runs, it creates an experiment named 3D plot reporting, which is associated with the examples project.
ClearML reports these plots in the ClearML Web UI > experiment page > RESULTS tab > PLOTS sub-tab.
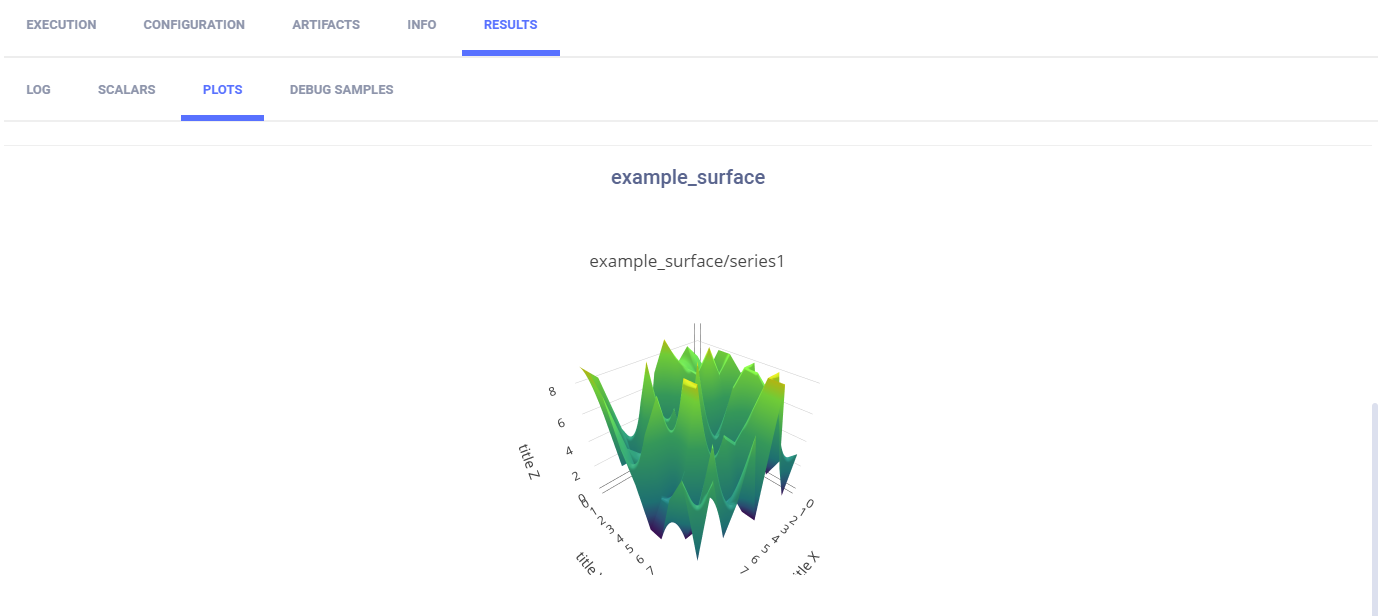
Surface plot
To plot a series as a surface plot, use the Logger.report_surface method.
    # report 3d surface
    surface = np.random.randint(10, size=(10, 10))
    Logger.current_logger().report_surface(
        "example_surface",
        "series1",
        iteration=iteration,
        matrix=surface,
        xaxis="title X",
        yaxis="title Y",
        zaxis="title Z",
    )
Visualize the reported surface plot in RESULTS > PLOTS.
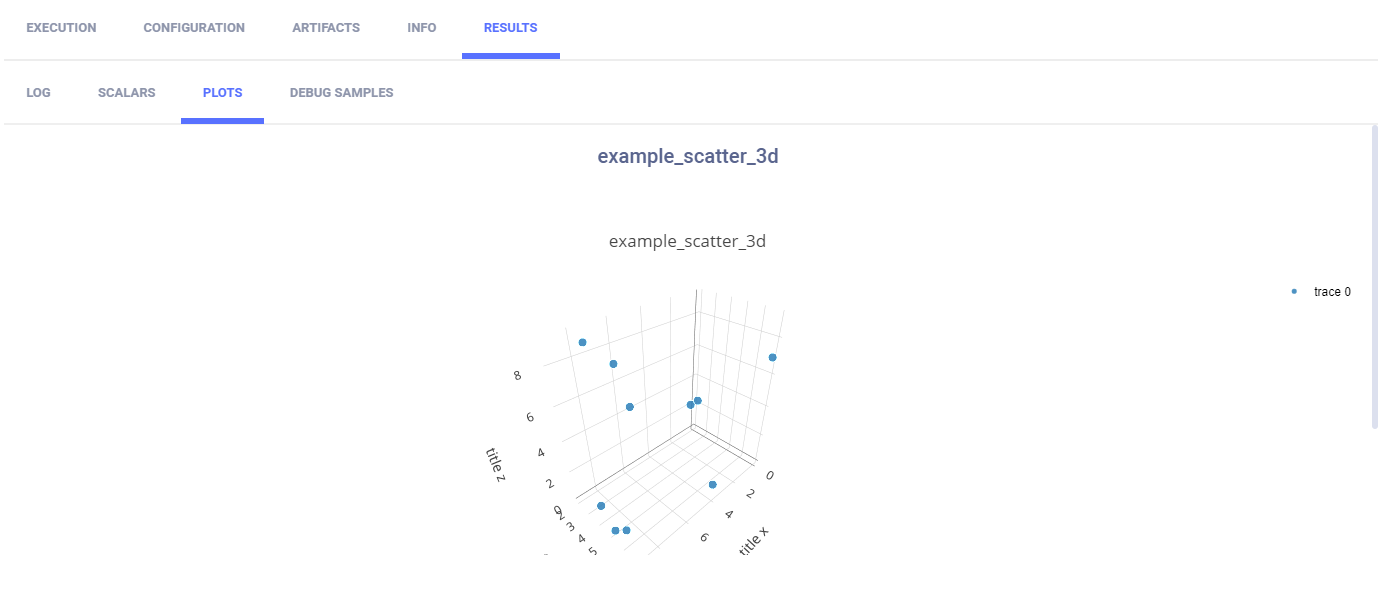
3D scatter plot
To plot a series as a 3-dimensional scatter plot, use the Logger.report_scatter3d method.
# report 3d scatter plot
scatter3d = np.random.randint(10, size=(10, 3))
Logger.current_logger().report_scatter3d(
    "example_scatter_3d",
    "series_xyz",
    iteration=iteration,
    scatter=scatter3d,
    xaxis="title x",
    yaxis="title y",
    zaxis="title z",
)
Visualize the reported 3D scatter plot in RESULTS > PLOTS.