2.8 KiB
| title |
|---|
| Project Dashboard |
:::info Pro Plan Offering The ClearML Project Dashboard App is available under the ClearML Pro plan :::
The Project Dashboard Application provides an overview of a project's progress. It presents an aggregated view of a chosen metric over the project's iterations, as well as project GPU and worker usage. It also supports alerts/warnings on failed Tasks via Slack integration.
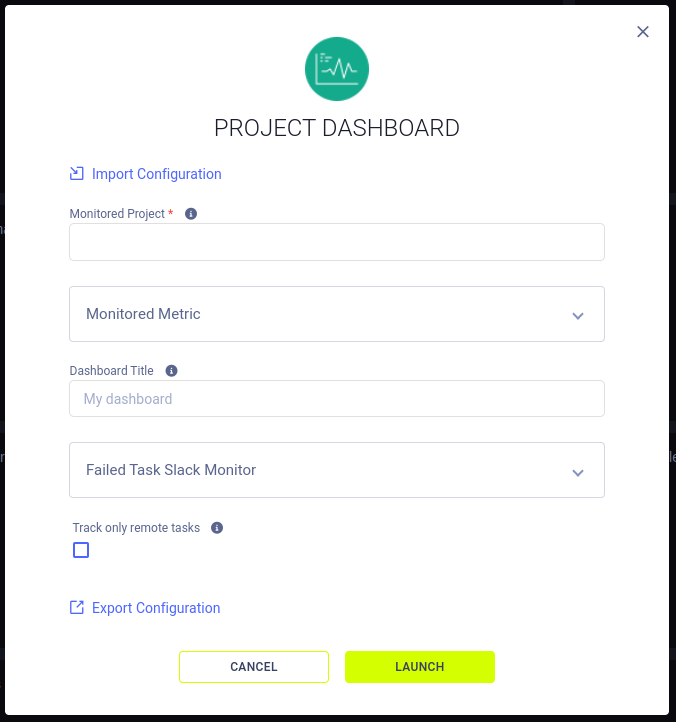
Project Dashboard Instance Configuration
- Import Configuration - Import an app instance configuration file. This will fill the configuration wizard with the values from the file, which can be modified before launching the app instance
- Monitored Project - Name of the ClearML project to monitor
- Monitored Metric
- Monitored Metric - Title - Metric title to track
- Monitored Metric - Series - Metric series (variant) to track
- Monitored Metric - Trend - Choose whether to track the monitored metric's highest or lowest values
- Dashboard Title - Name of the project dashboard instance, which will appear in the instance list
- Failed Task Slack Monitor (optional)
- API Token - Slack workspace access token
- Channel Name - Slack channel to which task failure alerts will be posted
- Fail Iteration Threshold - Minimum number of iterations to trigger Slack alerts about task failure (failed tasks that do not meet the threshold will be ignored)
- Export Configuration - Export the app instance configuration as a JSON file, which you can later import to create a new instance with the same configuration.
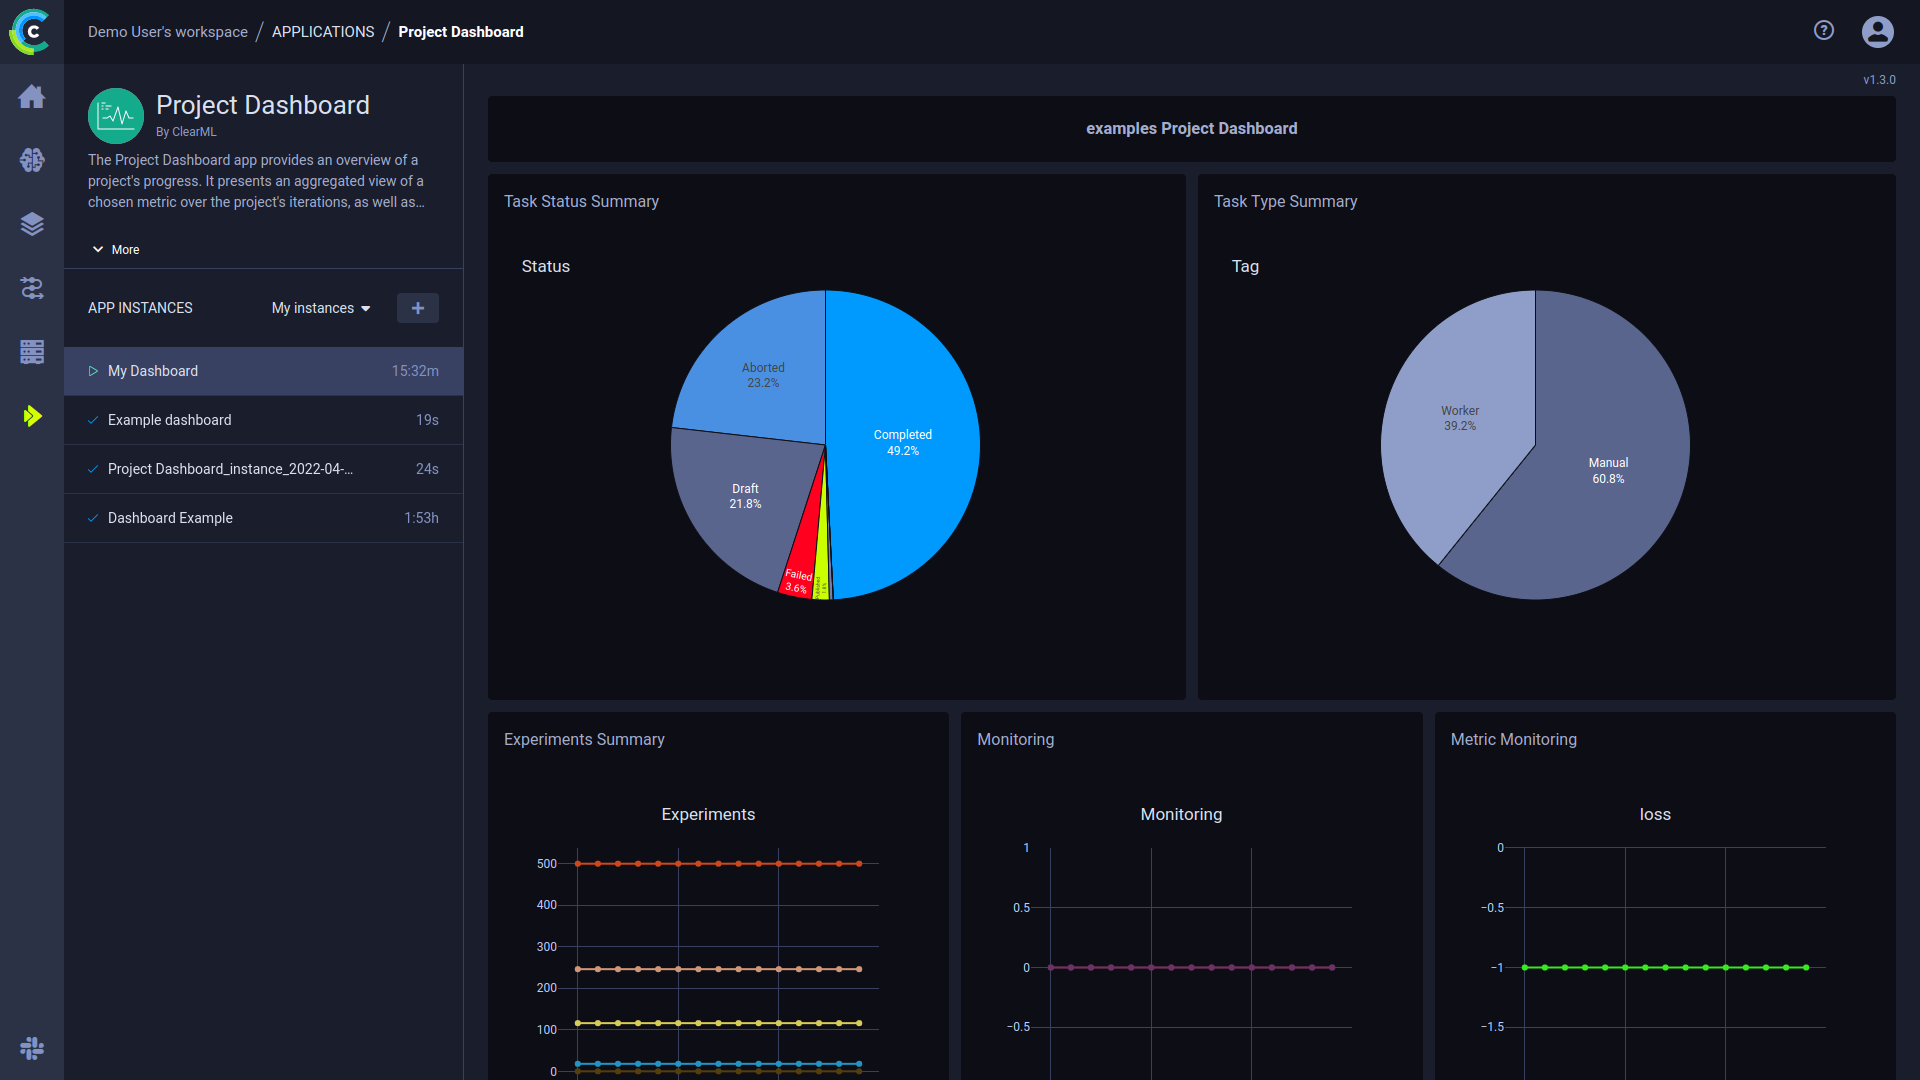
Dashboard
Once a project dashboard instance is launched, its dashboard displays the following information about a project:
- Task Status Summary - Percentages of Tasks by status
- Task Type Summary - Percentages of local experiments vs. agent experiments
- Experiments Summary - Number of tasks by status over time
- Monitoring - GPU utilization and GPU memory usage
- Metric Monitoring - An aggregated view of the values of a metric over time
- Project’s Active Workers - Number of workers currently executing experiments in the monitored project
- Workers Table - List of active workers
- Failed Experiments - Failed experiments and their time of failure summary
:::tip EMBEDDING CLEARML VISUALIZATION
You can embed plots from the app instance dashboard into ClearML Reports. These visualizations
are updated live as the app instance(s) updates. The Enterprise Plan and Hosted Service support embedding resources in
external tools (e.g. Notion). Hover over the plot and click ![]() to copy the embed code, and navigate to a report to paste the embed code.
:::
to copy the embed code, and navigate to a report to paste the embed code.
:::