mirror of
https://github.com/clearml/clearml-docs
synced 2025-01-31 22:48:40 +00:00
1.2 KiB
1.2 KiB
| title |
|---|
| Plotly Reporting |
The plotly_reporting.py example demonstrates ClearML's Plotly integration and reporting.
Report Plotly plots in ClearML by calling the Logger.report_plotly method, and passing a complex
Plotly figure, using the figure parameter.
In this example, the Plotly figure is created using plotly.express.scatter (see Scatter Plots in Python
in the Plotly documentation):
# Iris dataset
df = px.data.iris()
# create complex plotly figure
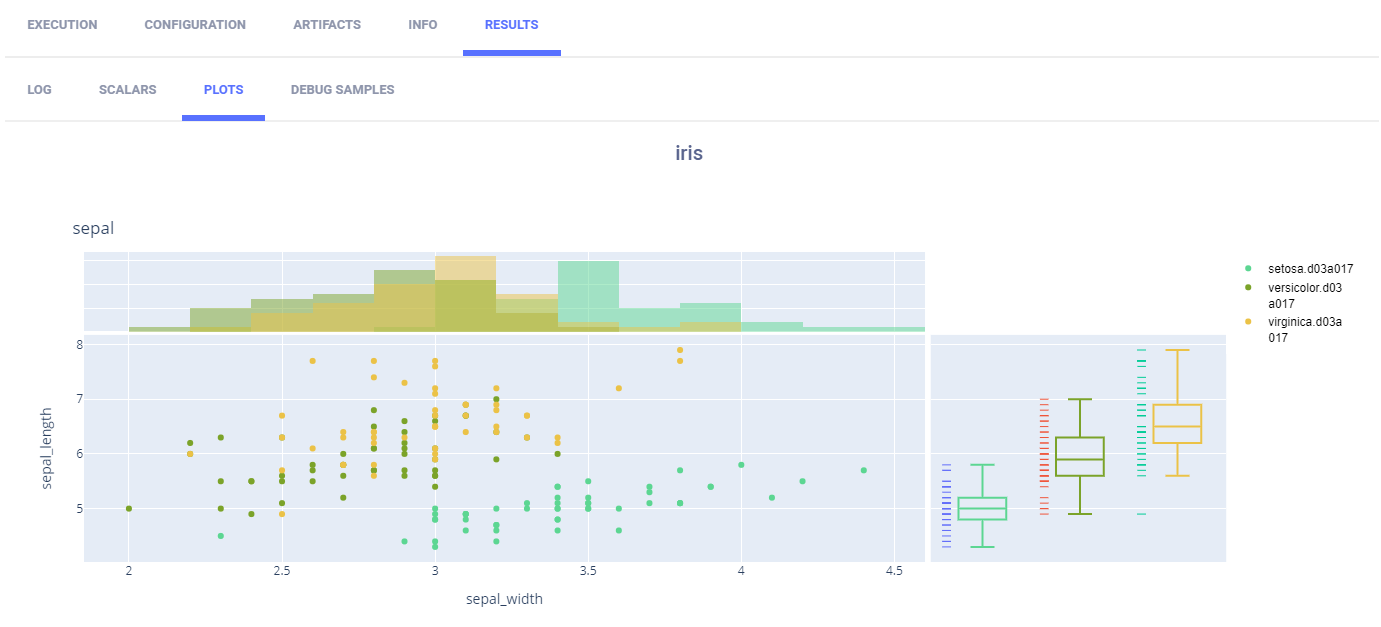
fig = px.scatter(df, x="sepal_width", y="sepal_length", color="species", marginal_y="rug", marginal_x="histogram")
# report the plotly figure
task.get_logger().report_plotly(title="iris", series="sepal", iteration=0, figure=fig)
When the script runs, it creates an experiment named plotly reporting, which is associated with the examples project.
ClearML reports Plotly plots in the ClearML Web UI > experiment details > RESULTS tab > PLOTS sub-tab.