--- title: Pipeline Run Details --- The run details panel shows the pipeline's structure and the execution status of every step, as well as the run's configuration parameters and output. 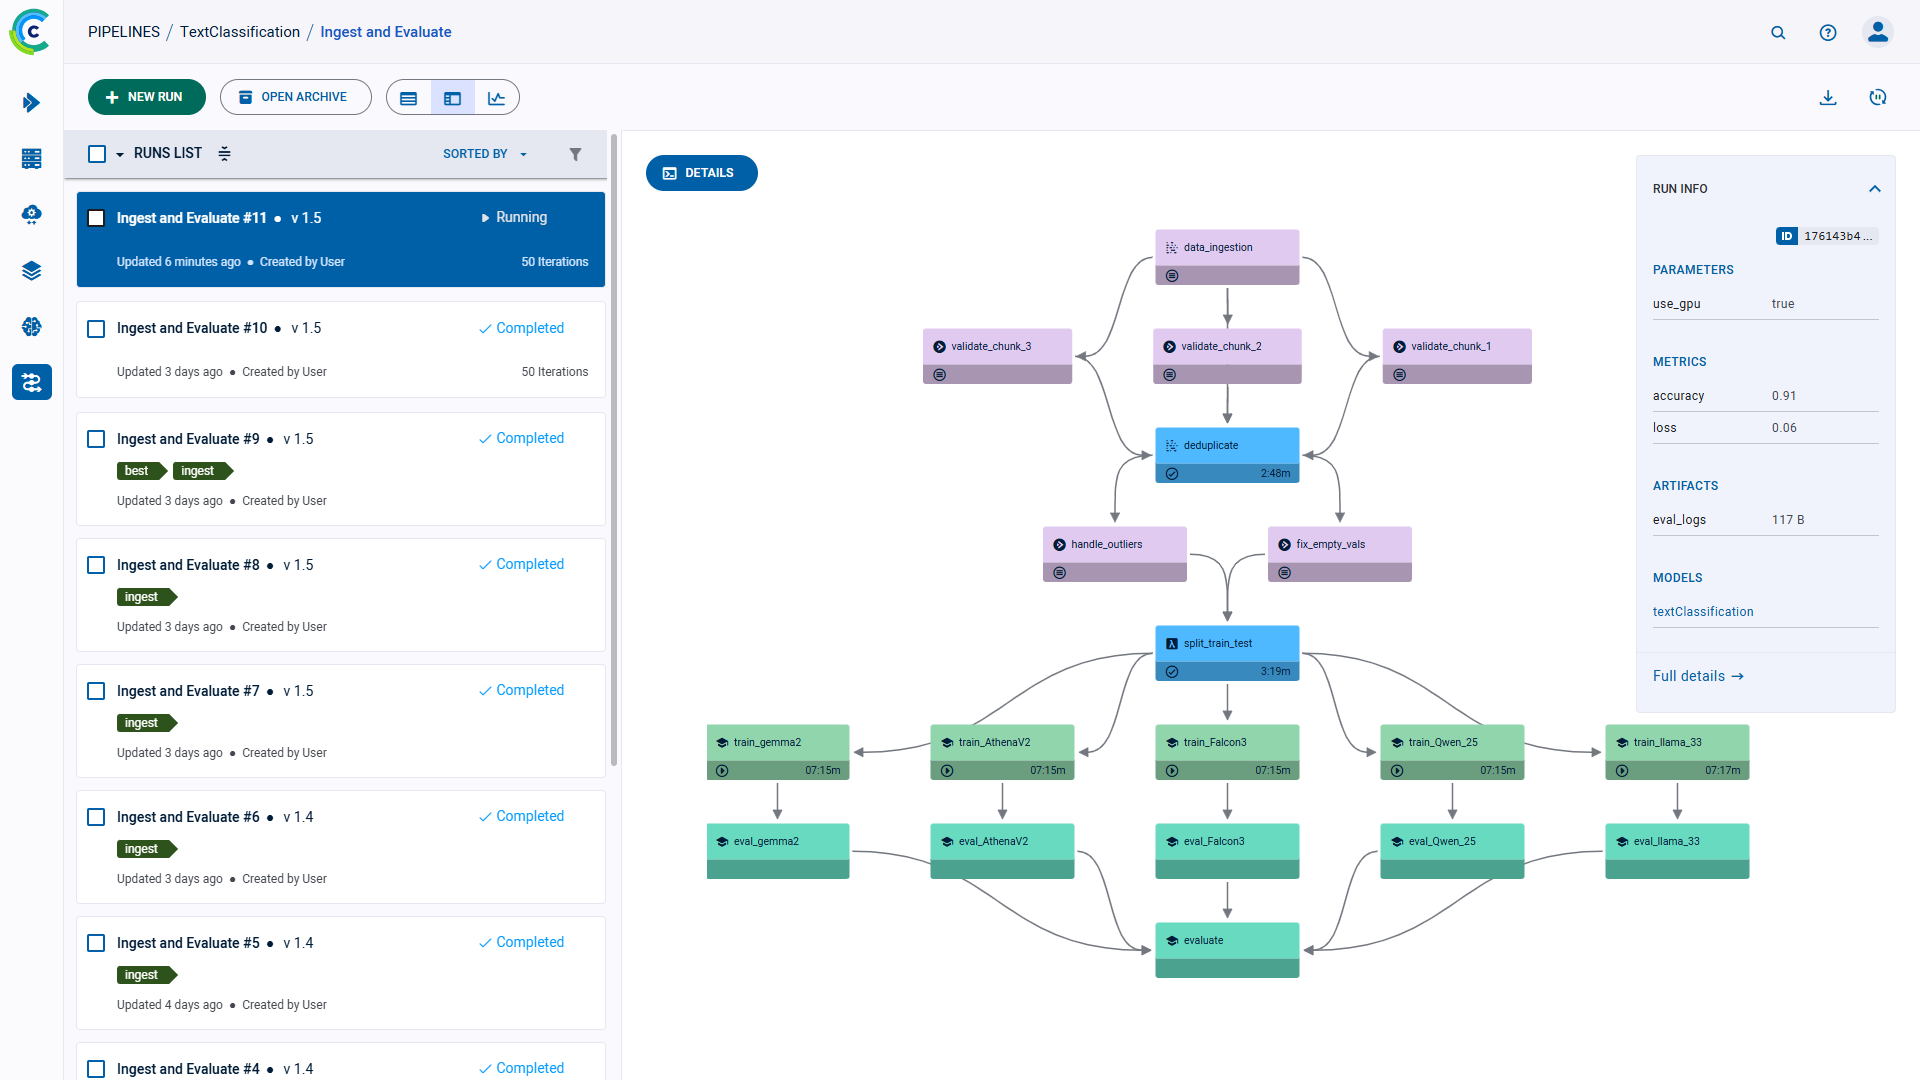 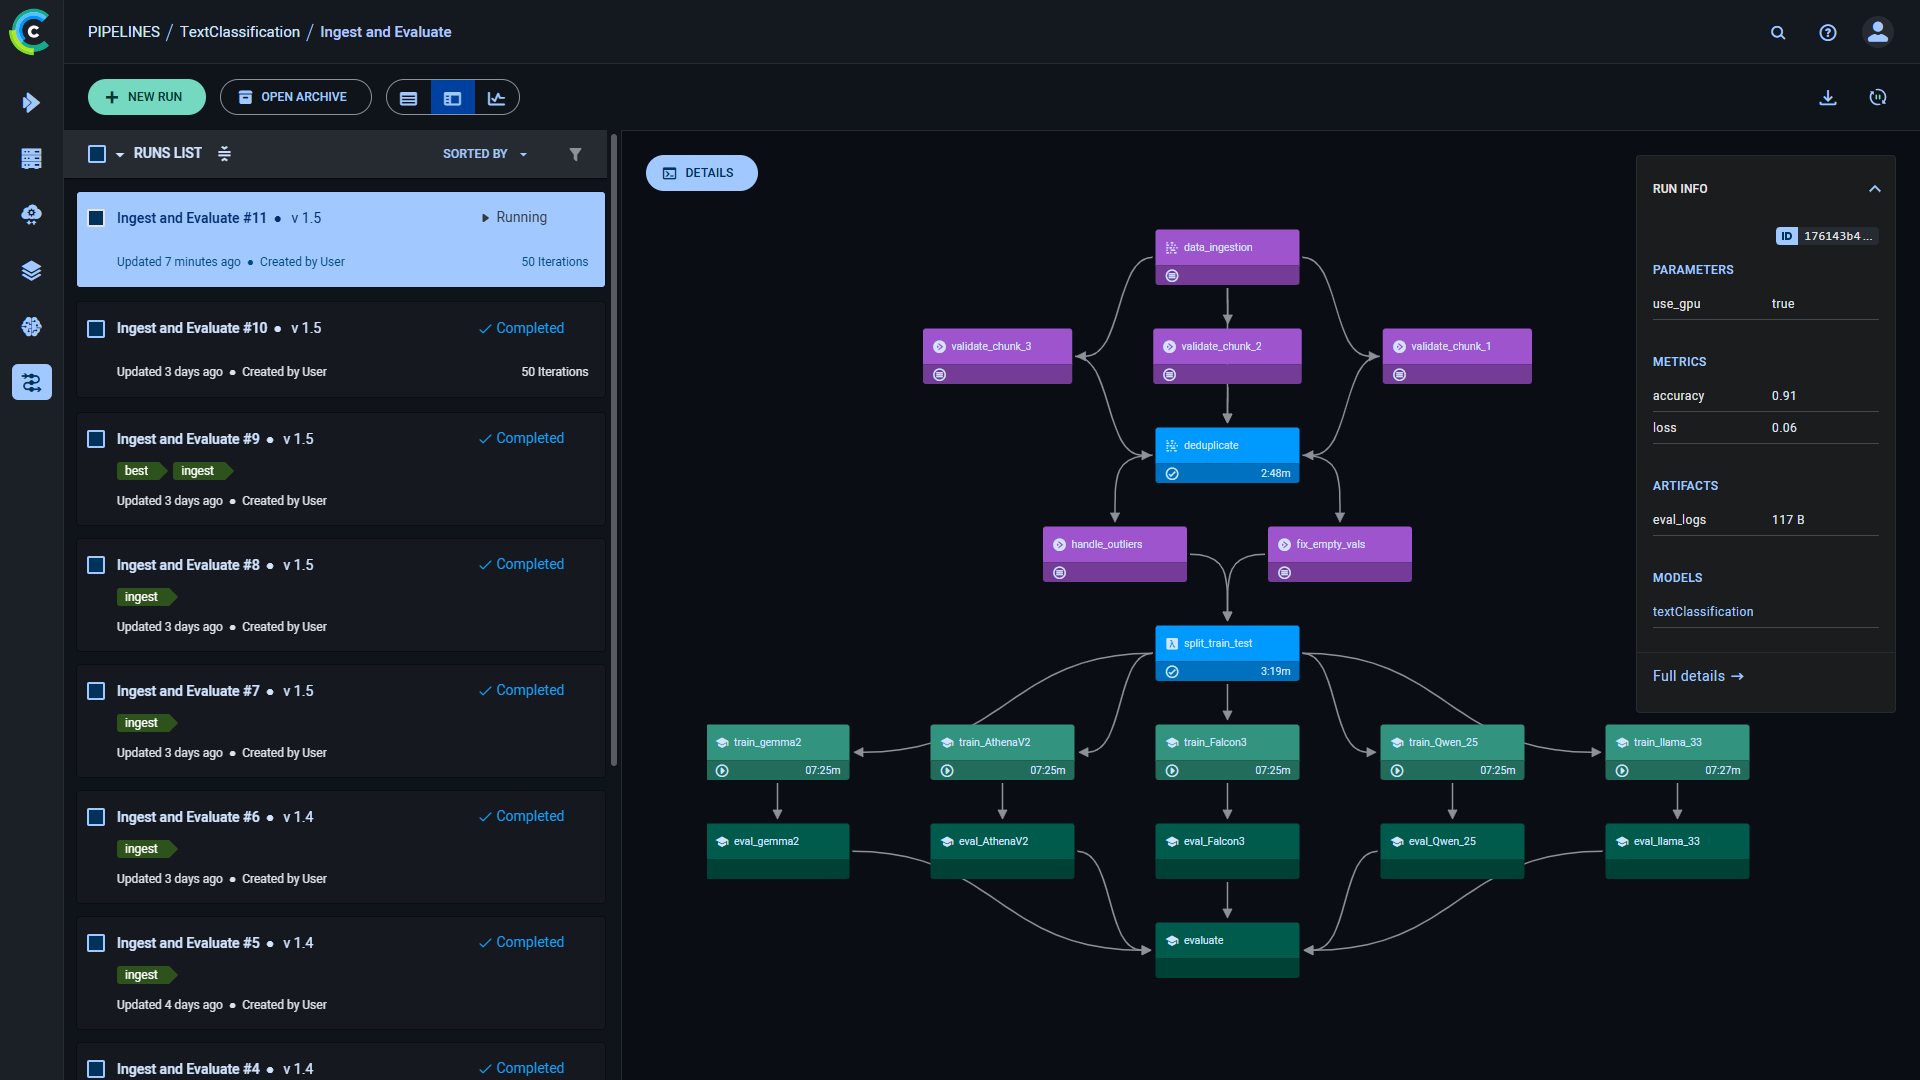 Each step shows: 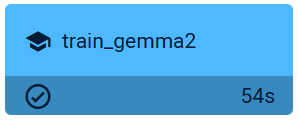 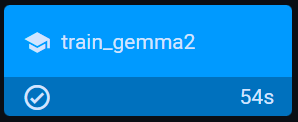 * Step name * Step status * Step execution time * Step log button - Hover over the step and click <img src="/docs/latest/icons/ico-console.svg" alt="console" className="icon size-md space-sm" /> to view the step's [details panel](#run-and-step-details-panel) While the pipeline is running, the steps' details and colors are updated. ## Run Stages Steps that were set into the same stage when created, are grouped into stages in the Run Details panel. In stages view, click`Expand Stages` to view the complete pipeline DAG with all steps visible. In the detailed view, click `Collapse Stages` to view the pipeline DAG outline with the same stage steps grouped into a single stage. 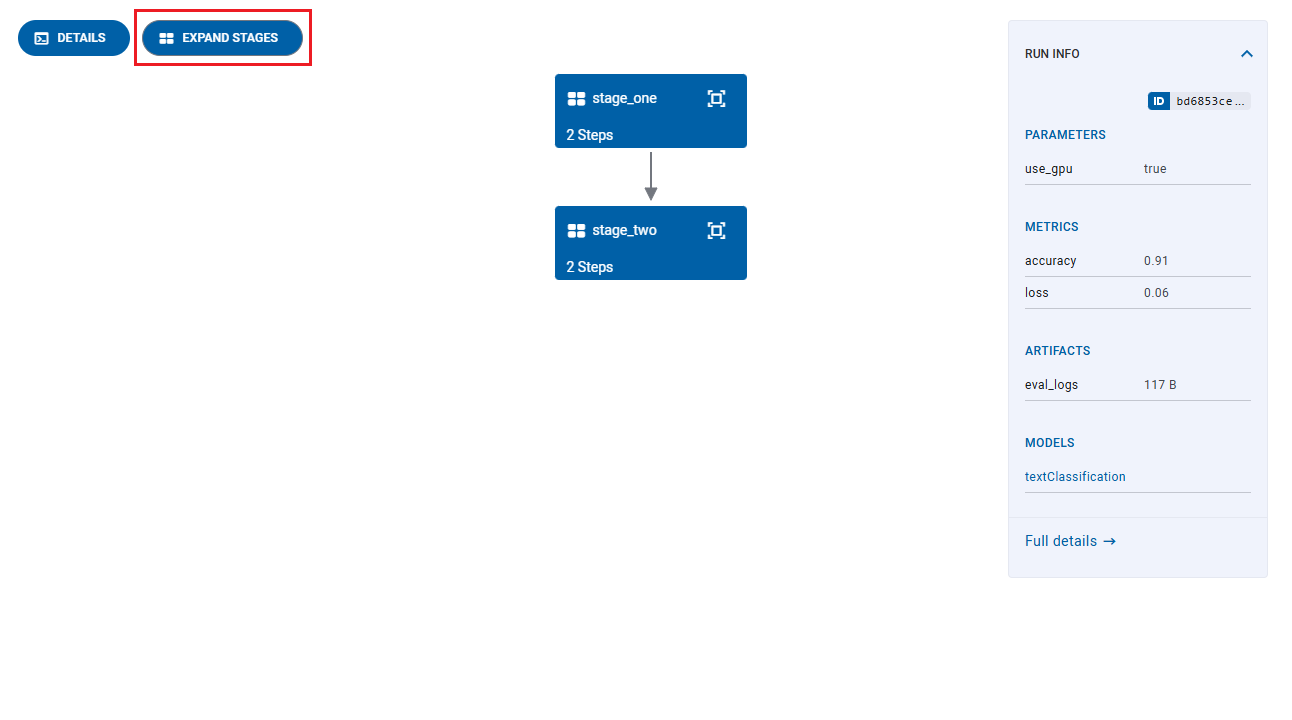 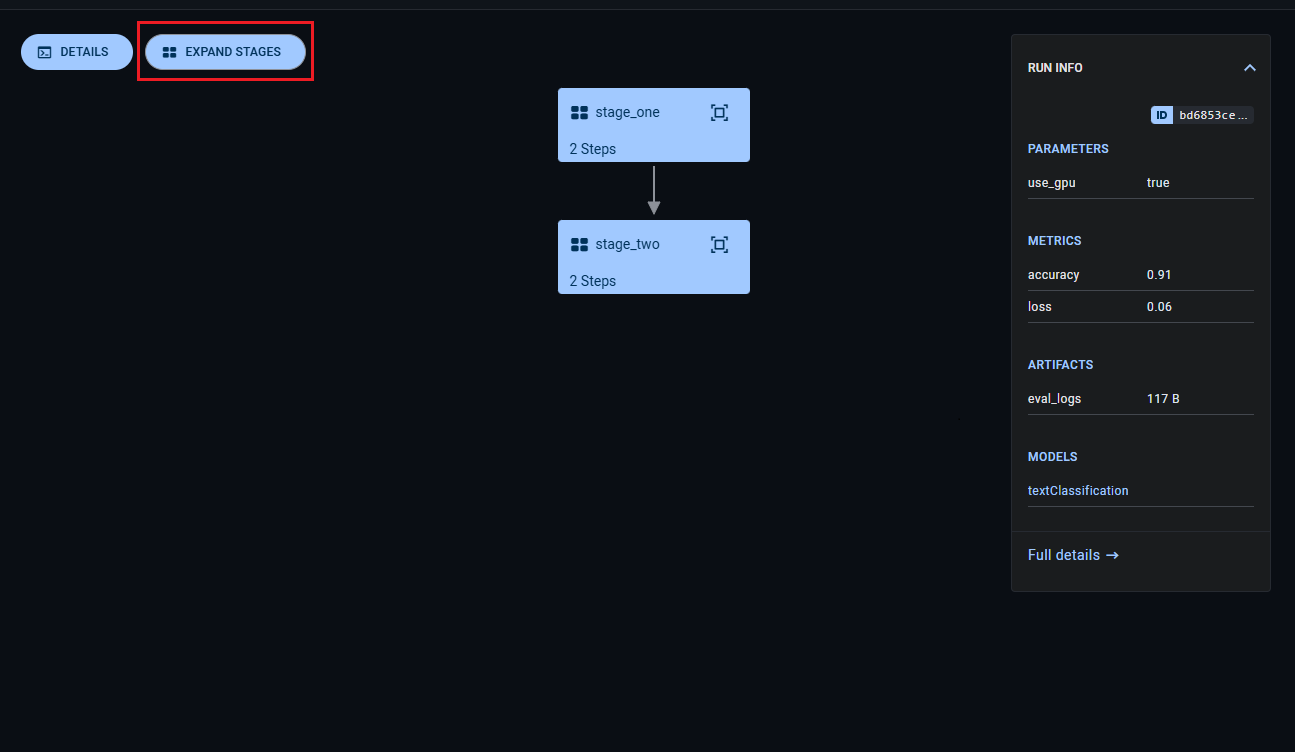 In the collapsed view, each stage displays: <div class="max-w-25">   </div> * Stage name * Number of steps in stage Click <img src="/docs/latest/icons/ico-zoom-to-fit.svg" alt="Expand" className="icon size-md space-md" /> to view the steps that comprise the stage. Select a step to view its [Step Info](#run-and-step-info). Click on a stage to view its **STAGE INFO**: <div class="max-w-50">   </div> * Stage name * Step count by status - The number of steps in each status category (e.g. completed, running, pending) ## Run and Step Details ### Run and Step Info On the pipeline run panel, view the **RUN INFO** which shows: * Run Parameters * Reported Metrics * Produced Artifacts * Output Models <div class="max-w-25"> 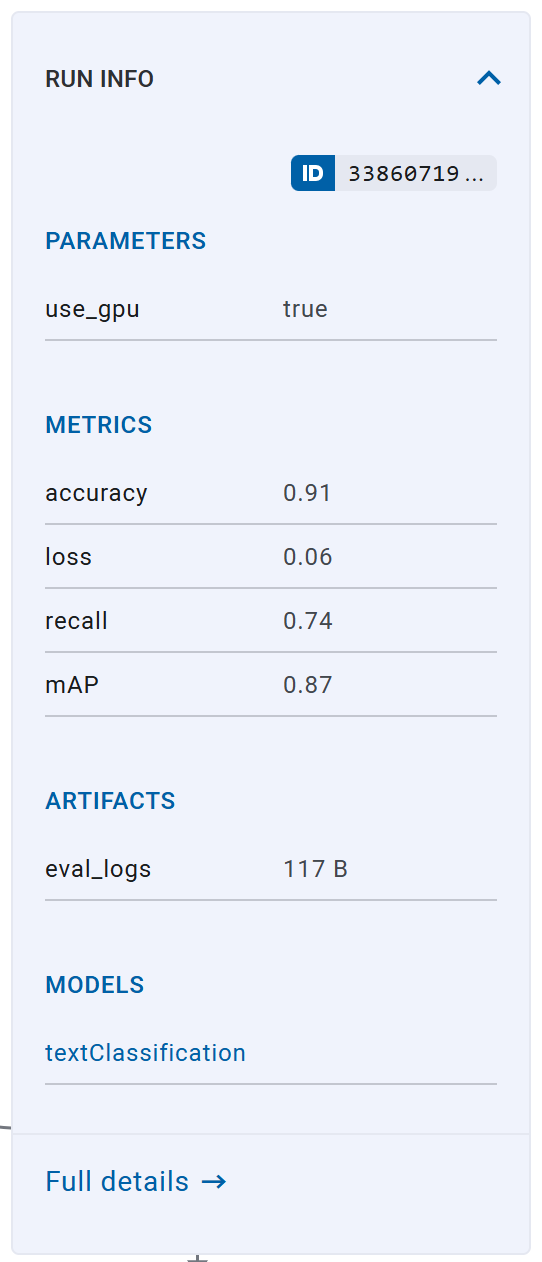 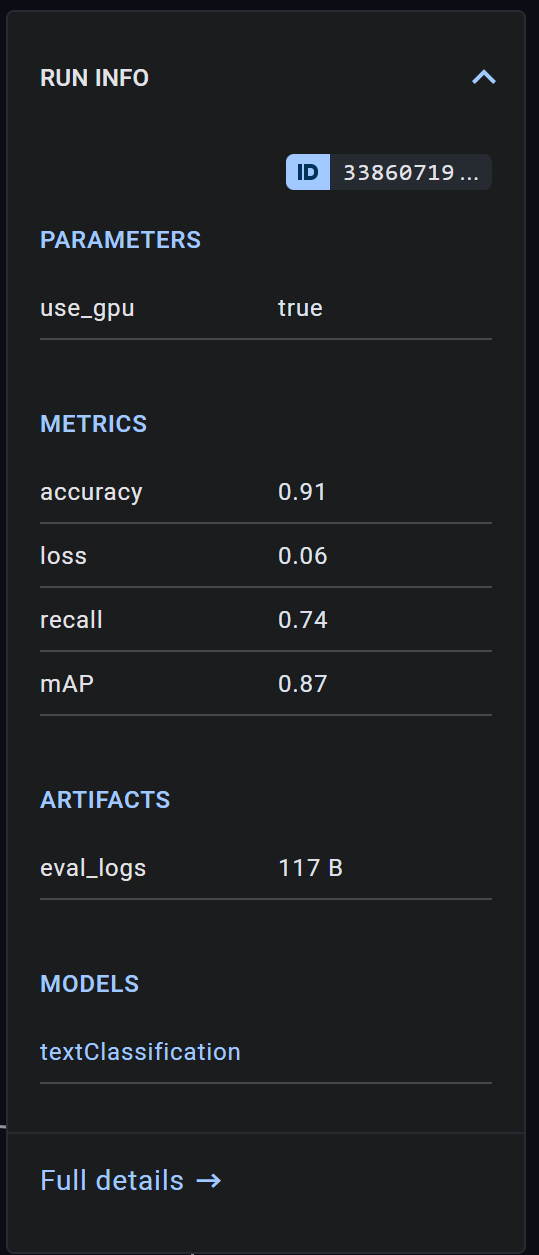 </div> To view a run's complete information, click **Full details**, which will open the pipeline's controller [task page](../webapp_exp_track_visual.md). View each list's complete details in the pipeline task's corresponding tabs: * **PARAMETERS** list > **CONFIGURATION** tab * **METRICS** list > **SCALARS** tab * **ARTIFACTS** and **MODELS** lists > **ARTIFACTS** tab  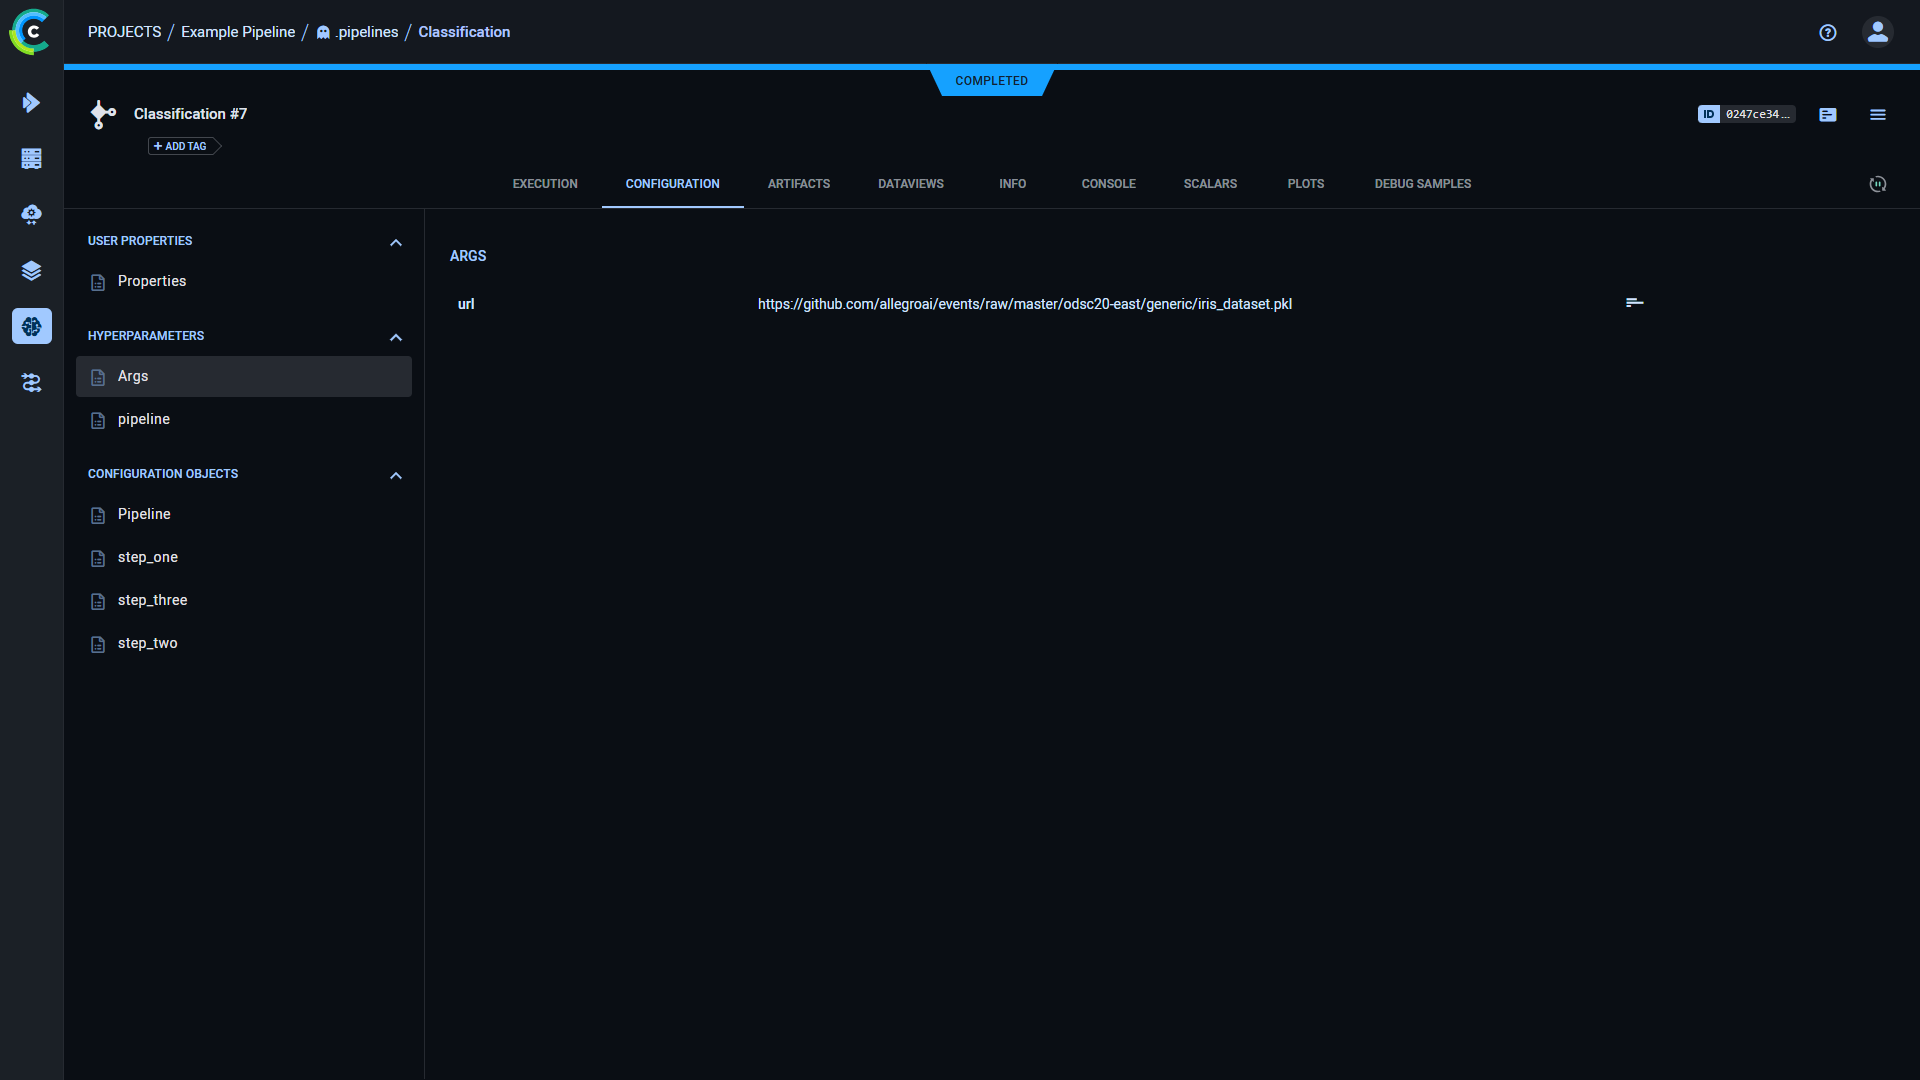 To view a specific step's information, click the step on the execution graph, and the info panel displays its **STEP INFO**. The panel displays the step's name, task type, and status, as well as its parameters, metrics, artifacts, and models. 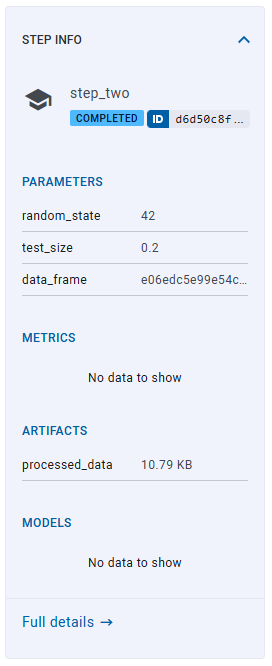 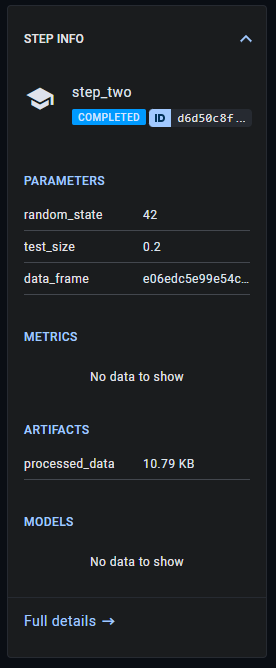 To return to viewing the run's information, click the pipeline graph, outside any of the steps. ### Run and Step Details Panel Click on **DETAILS** on the top left of the info panel to view the pipeline controller's details panel. To view a step's details panel, click **DETAILS** and then click on a step node, or hover over a step node and click <img src="/docs/latest/icons/ico-console.svg" alt="details" className="icon size-md space-sm" />. The details panel includes three tabs: * **Preview** - View debug samples and plots attached to the pipeline controller or step 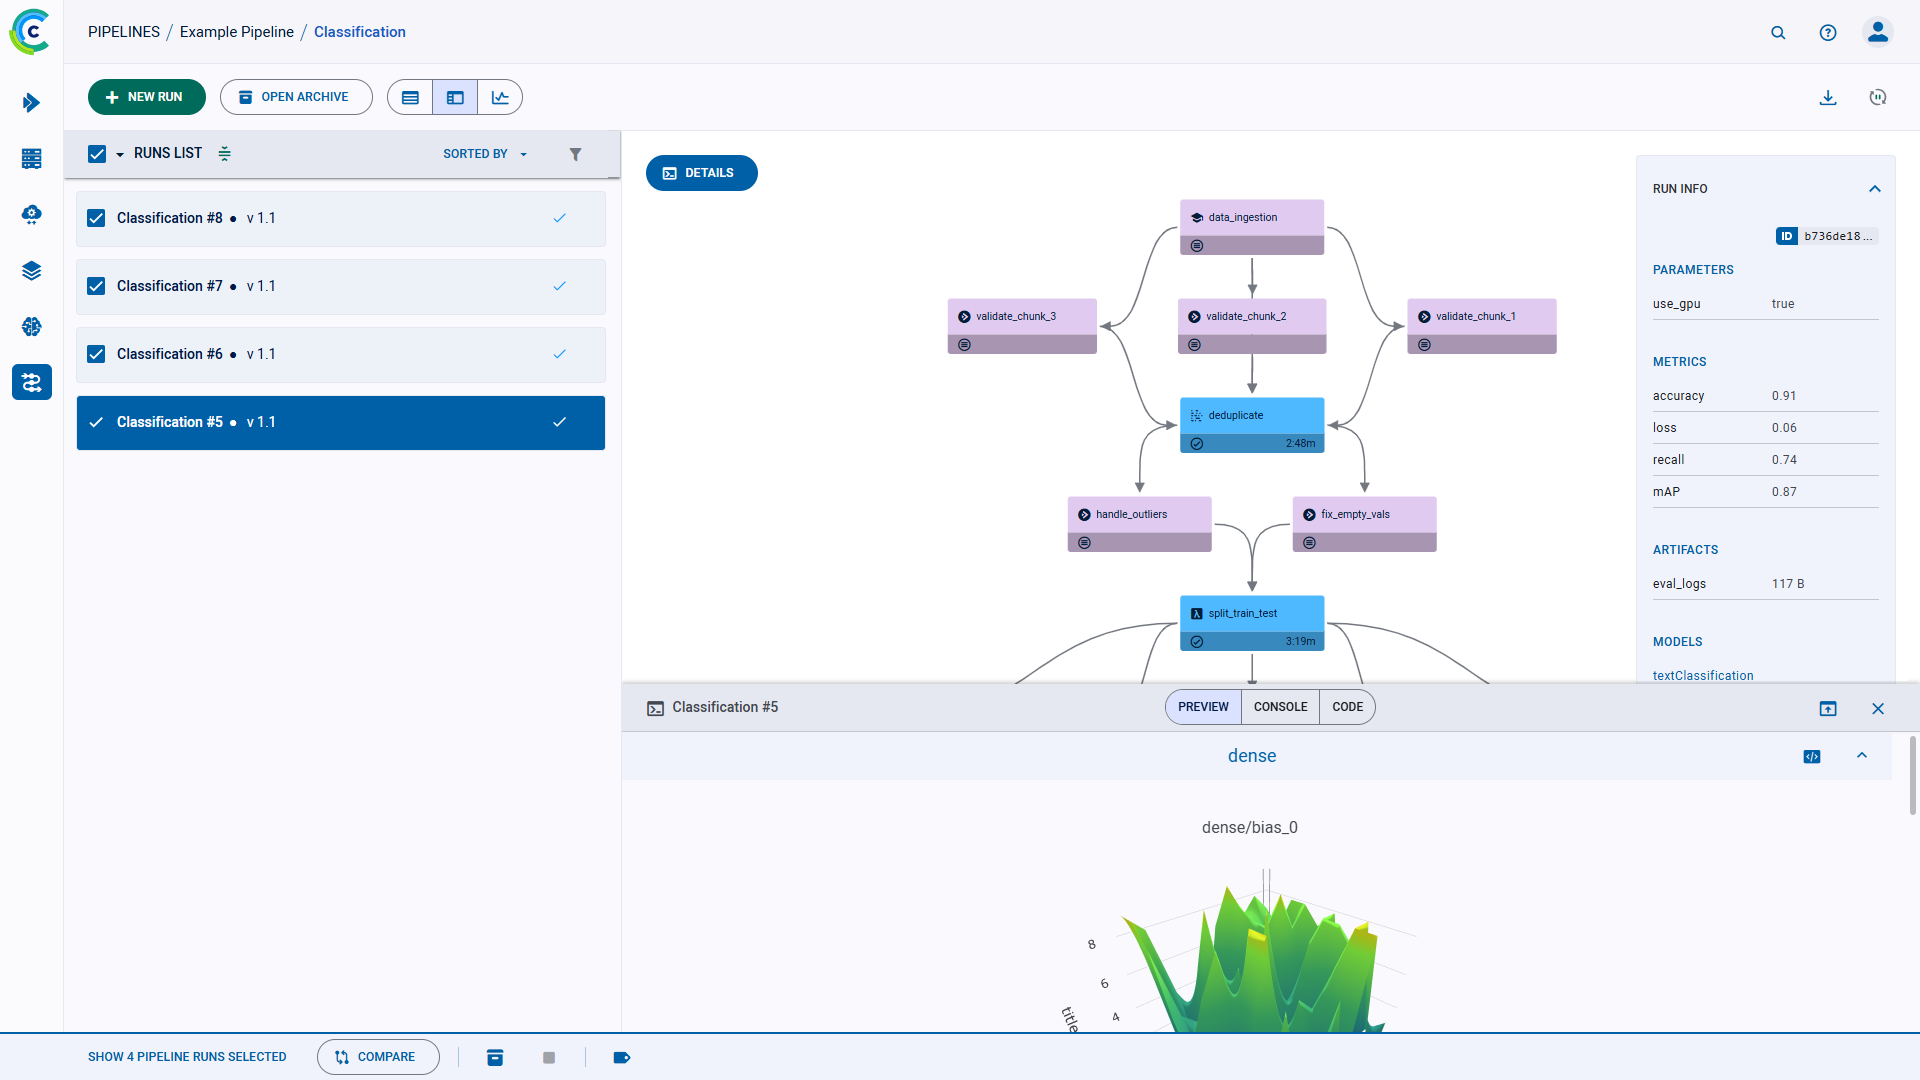 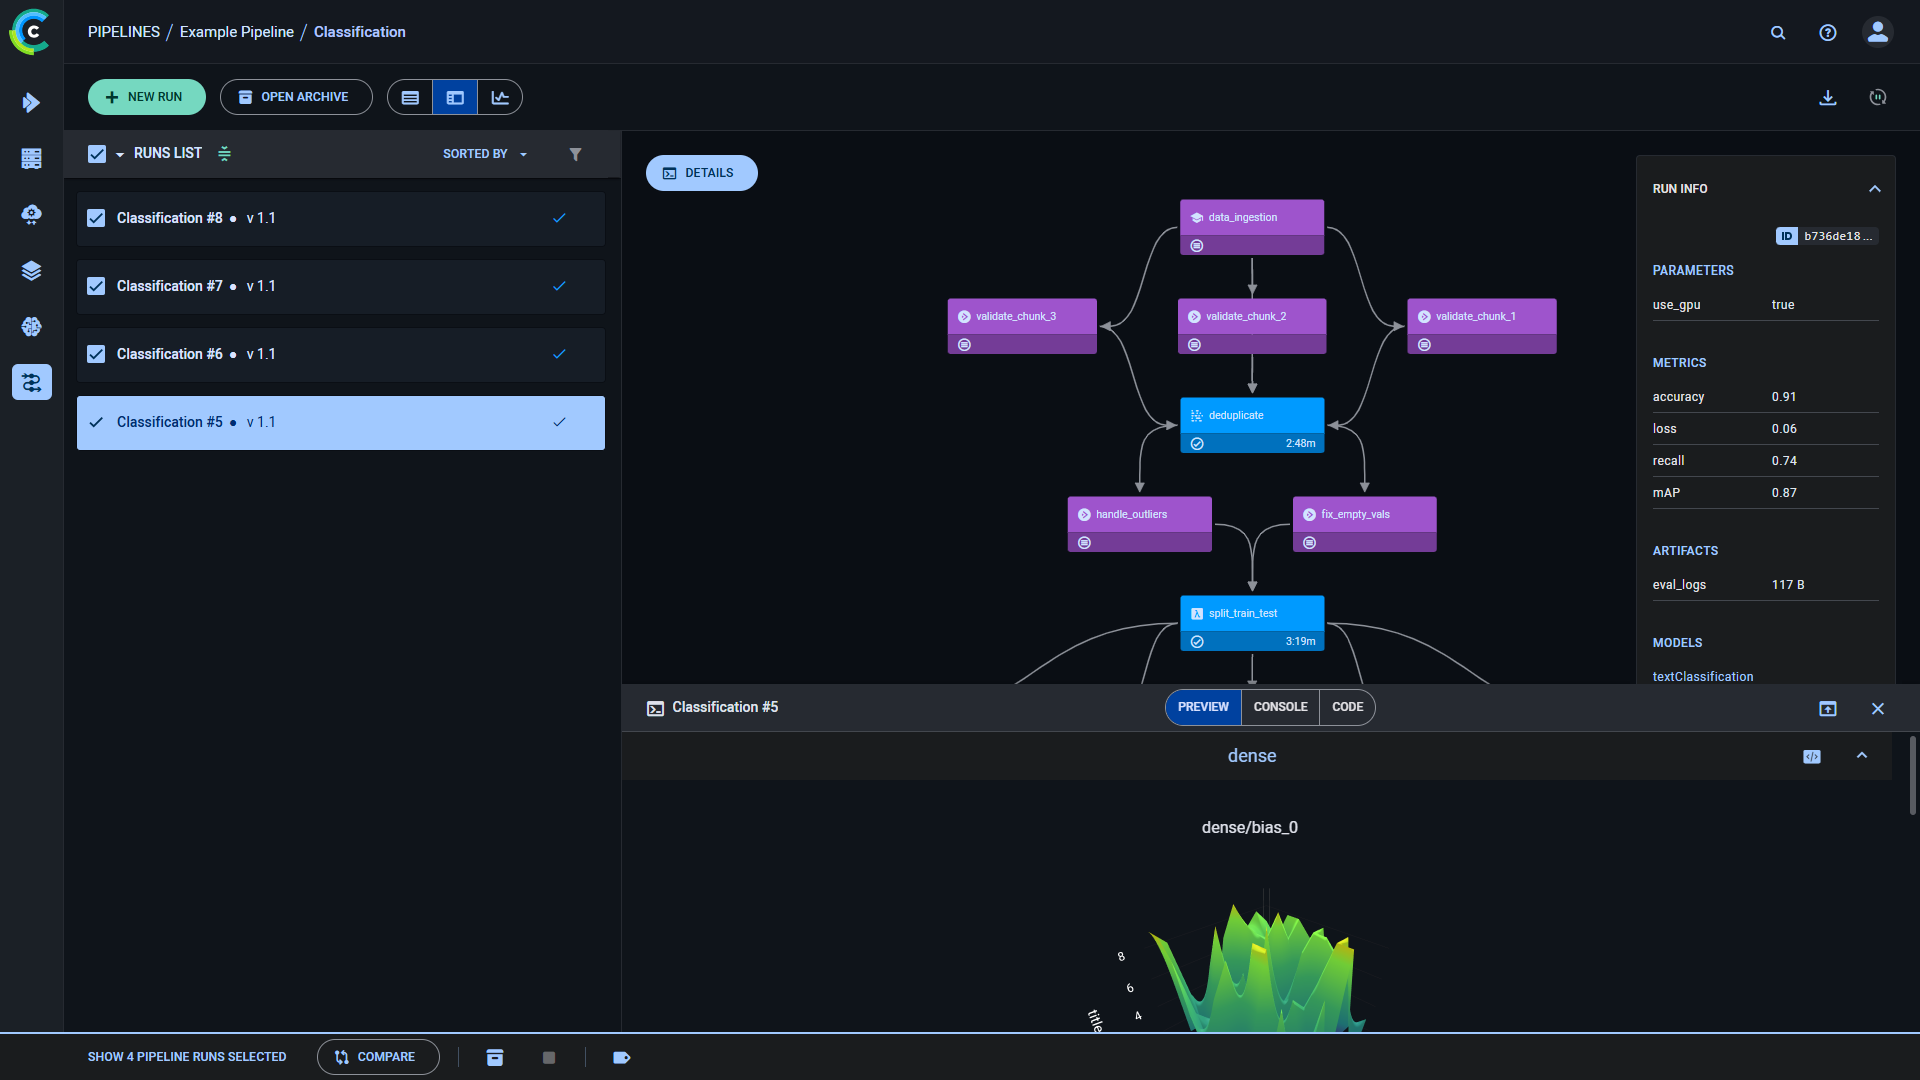 * **Console** - The console log for the pipeline controller or steps: contains everything printed to stdout and stderr. 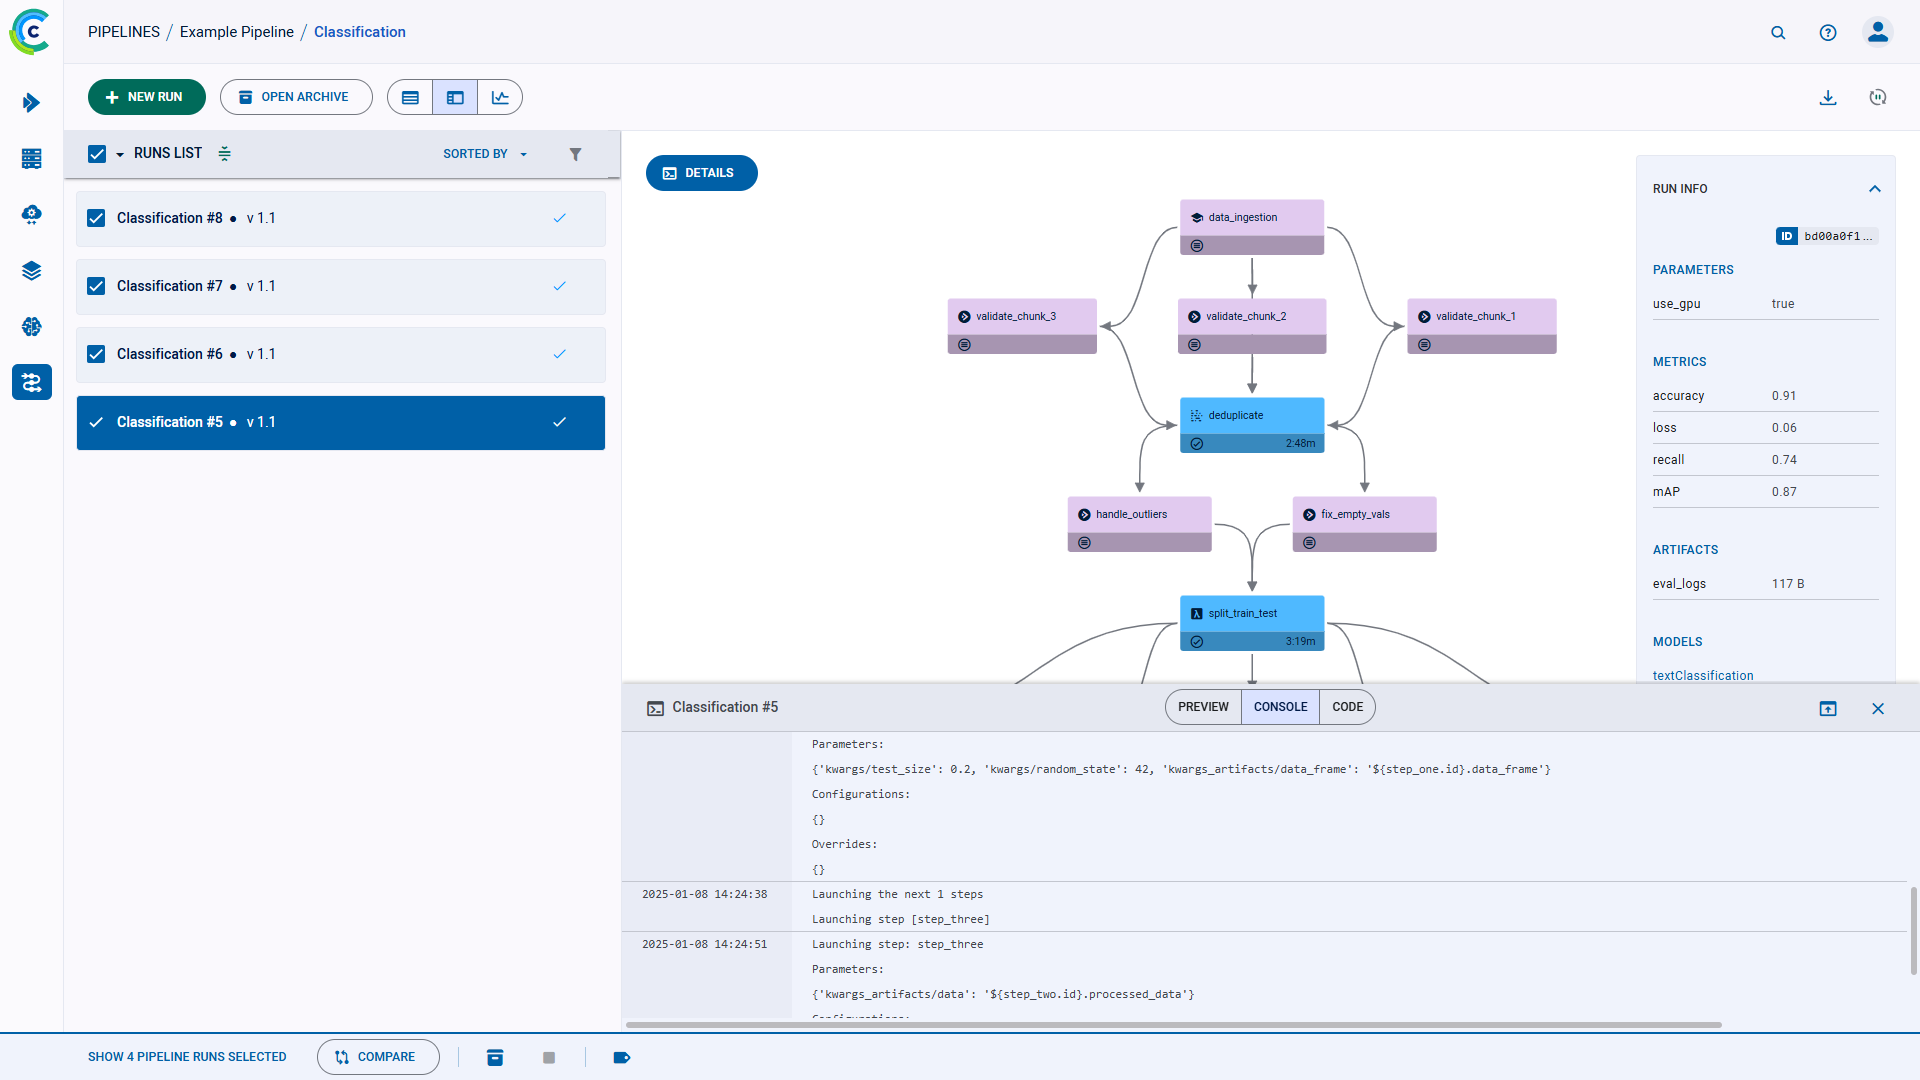 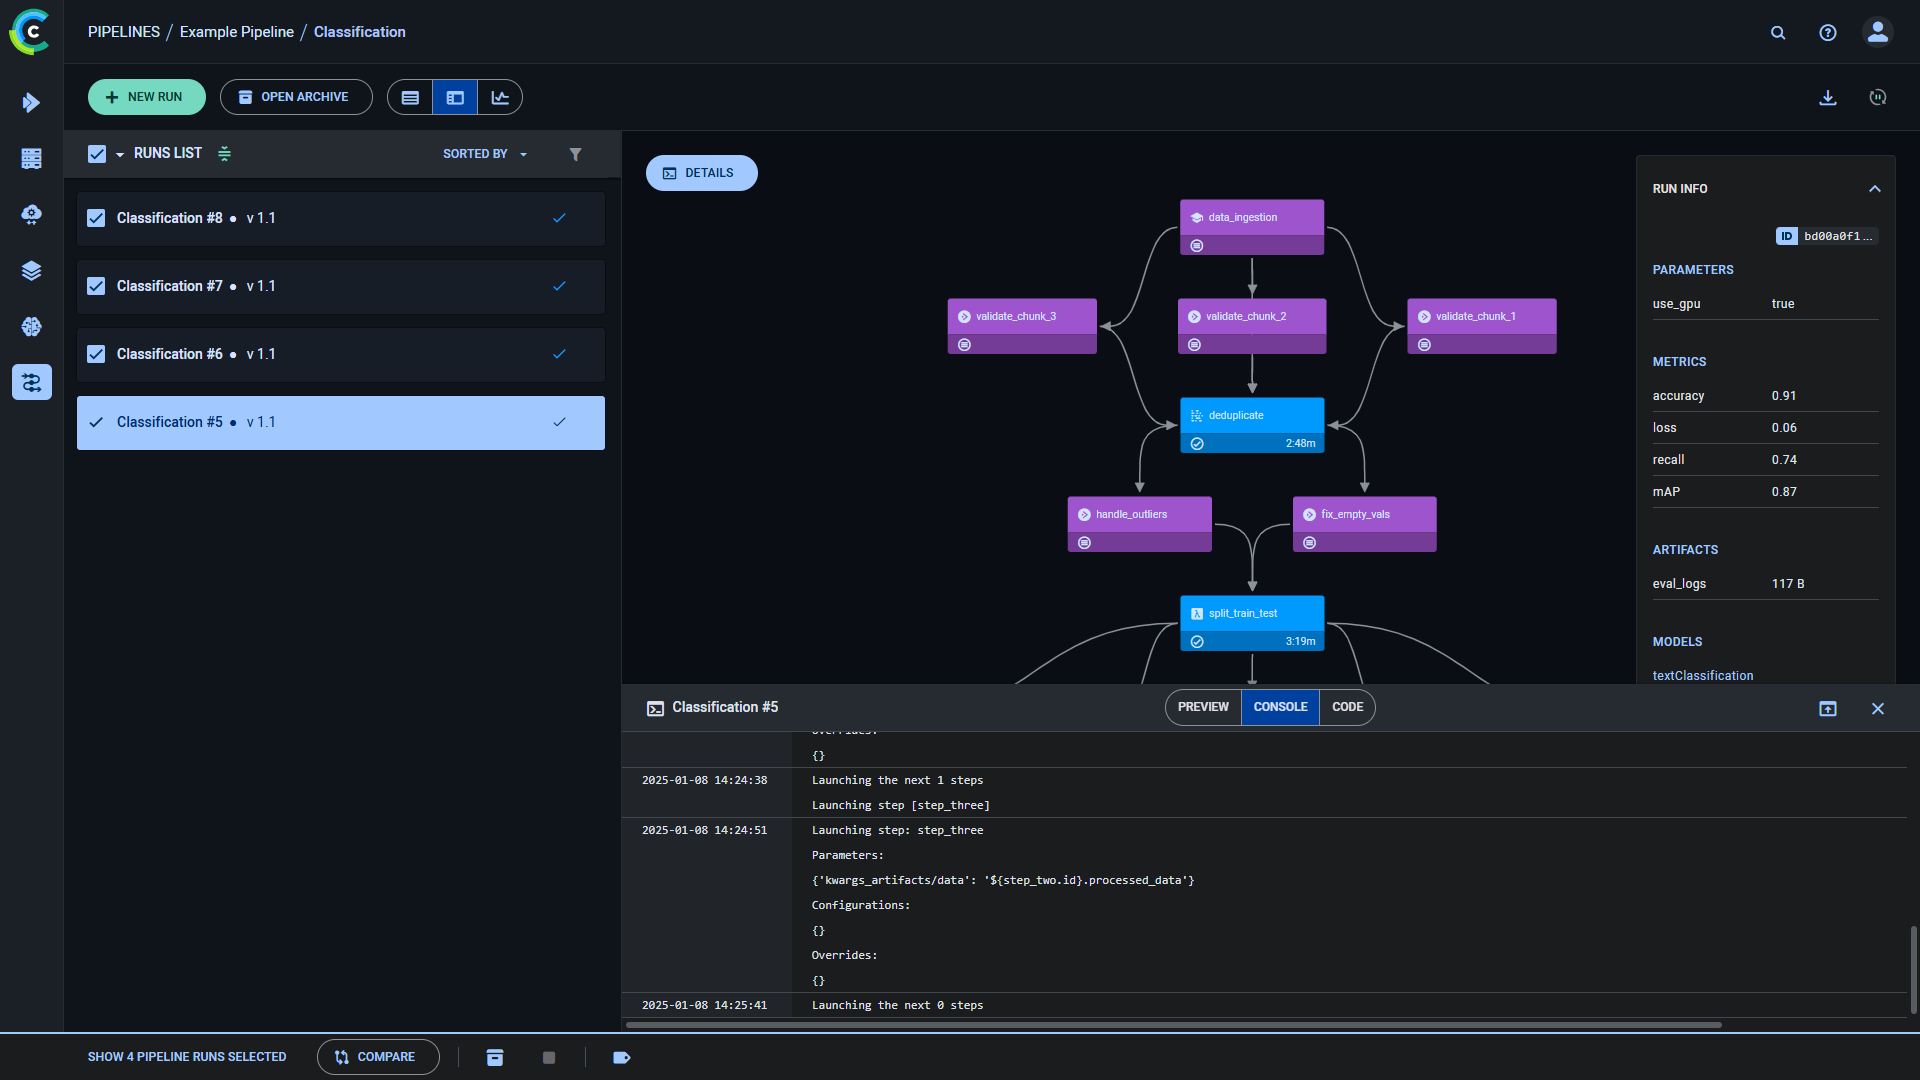 * **Code** - For pipeline steps generated from functions using either [`PipelineController.add_function_step`](../../references/sdk/automation_controller_pipelinecontroller.md#add_function_step) or [`PipelineDecorator.component`](../../references/sdk/automation_controller_pipelinedecorator.md#pipelinedecoratorcomponent), you can view the selected step's code. 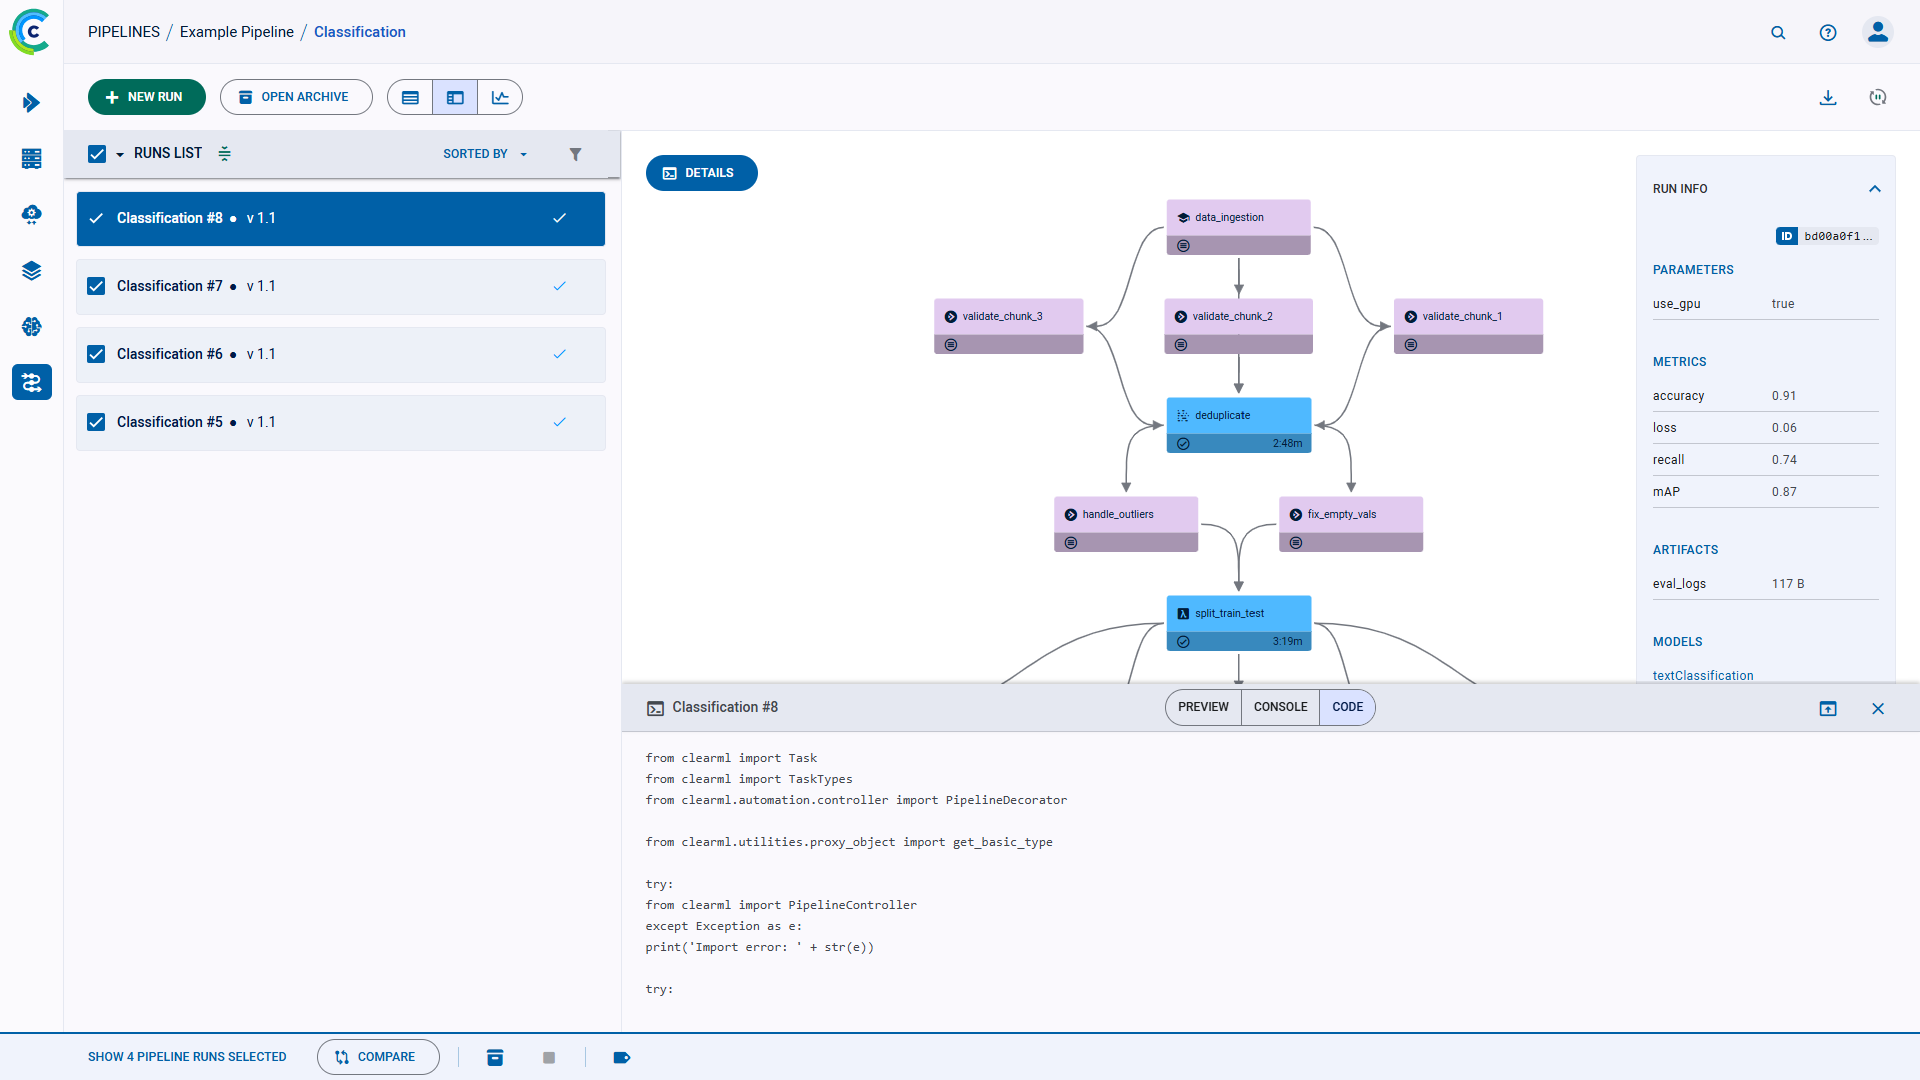 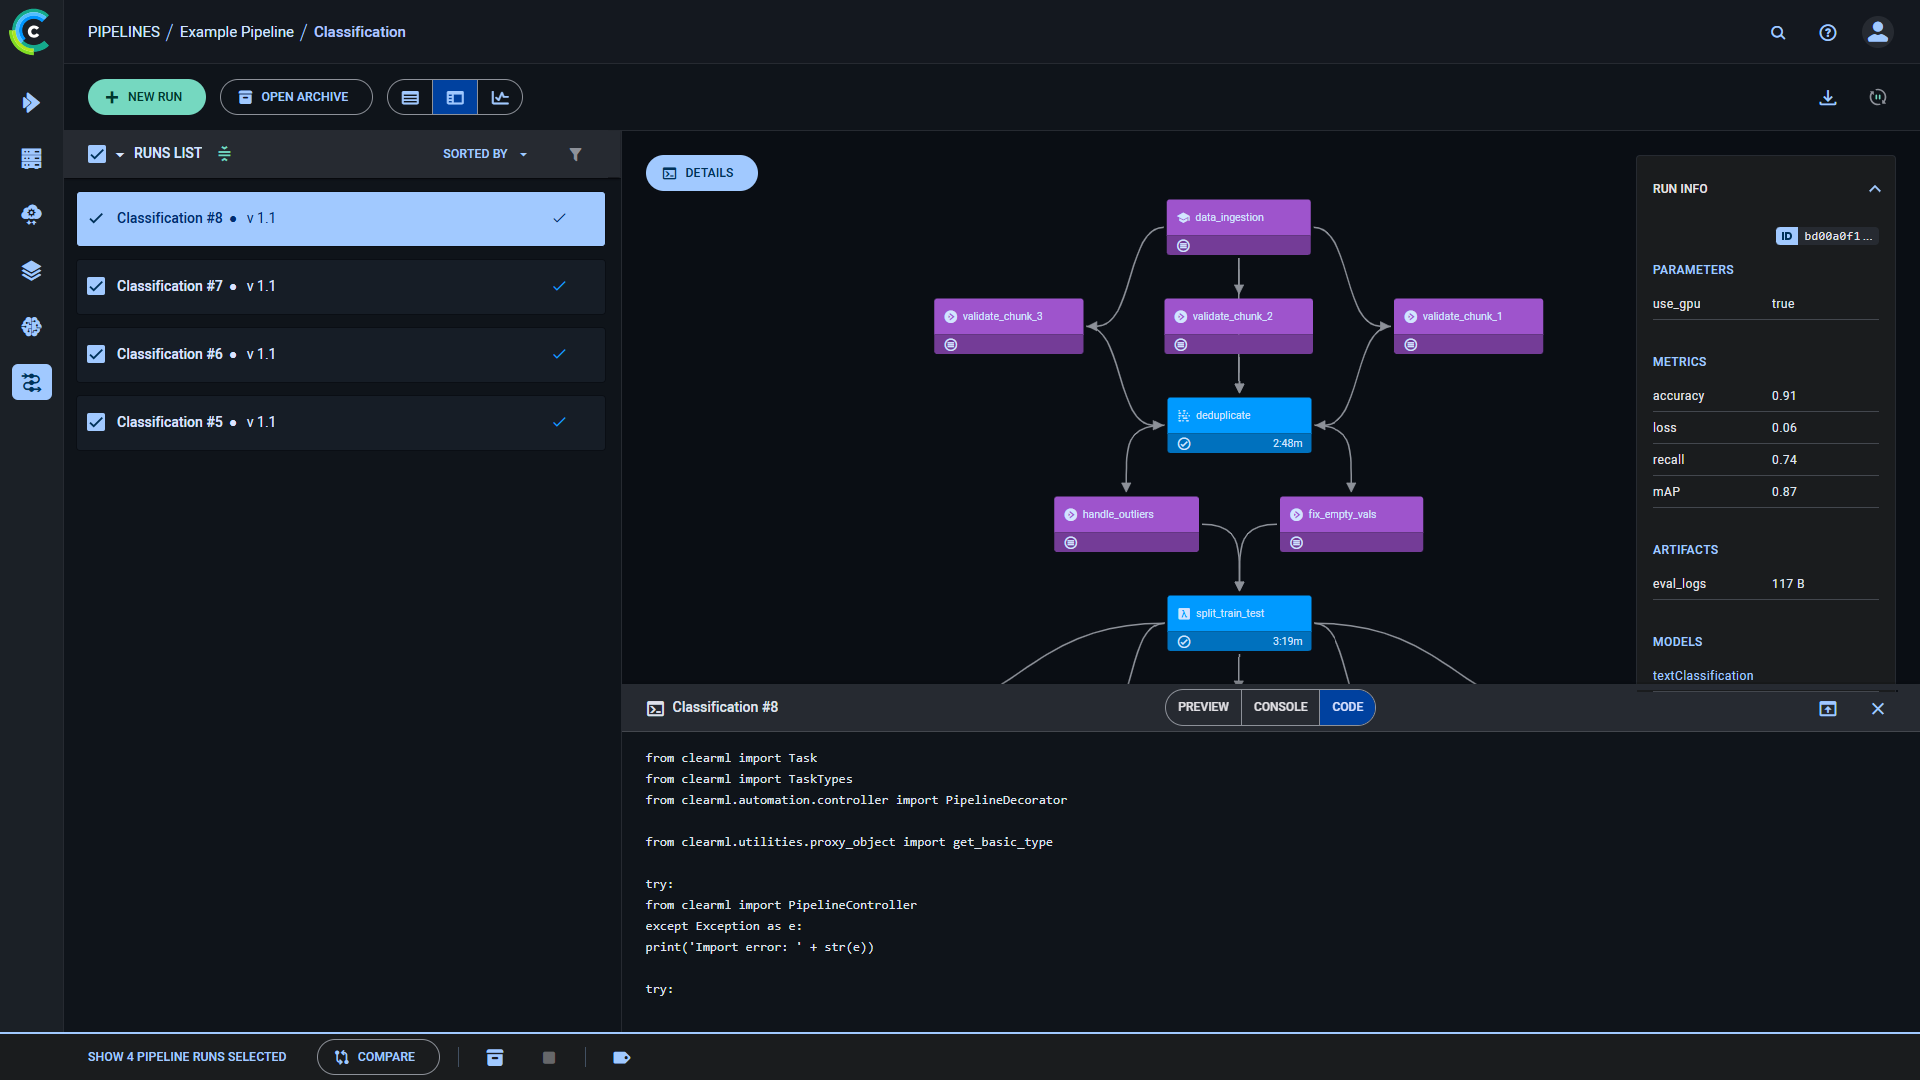 Click <img src="/docs/latest/icons/ico-max-panel.svg" alt="Expand" className="icon size-md space-sm" /> on the details panel header to view the panel in full screen.