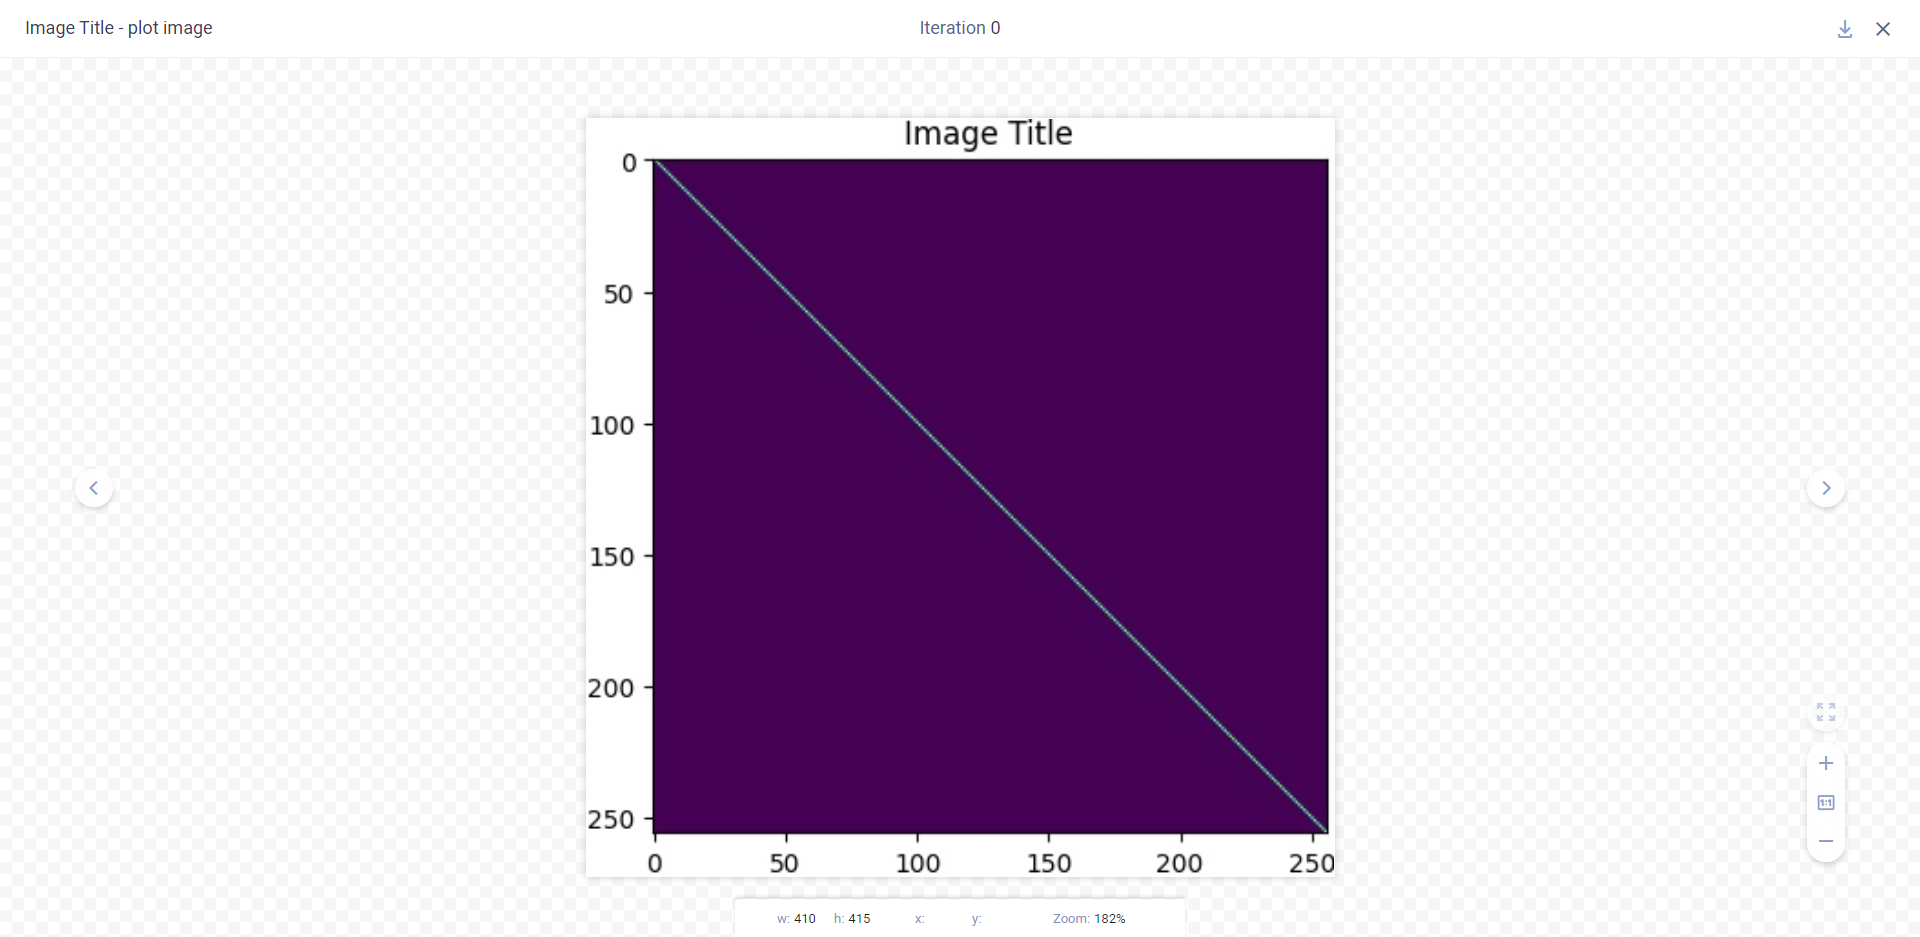
--- title: Matplotlib displayed_sidebar: mainSidebar --- The example below demonstrates integrating ClearML into code that uses `matplotlib` to plot scatter diagrams, and show images. ClearML automatically logs the diagrams and images. View the example in [script](https://github.com/allegroai/clearml/blob/master/examples/frameworks/matplotlib/matplotlib_example.py) or in [Jupyter Notebook](https://github.com/allegroai/clearml/blob/master/examples/frameworks/matplotlib/jupyter_matplotlib_example.ipynb). :::note The example in [Jupyter Notebook](https://github.com/allegroai/clearml/blob/master/examples/frameworks/matplotlib/jupyter_matplotlib_example.ipynb) includes a clickable icon to open the notebook in Google Colab. ::: When the example runs, it creates an experiment named `Matplotlib example`, which is associated with the `examples` project (in script) or the `Colab notebooks` project (in Jupyter Notebook). ## Plots The scatter plots appear in the **ClearML Web UI**, in **PLOTS**. 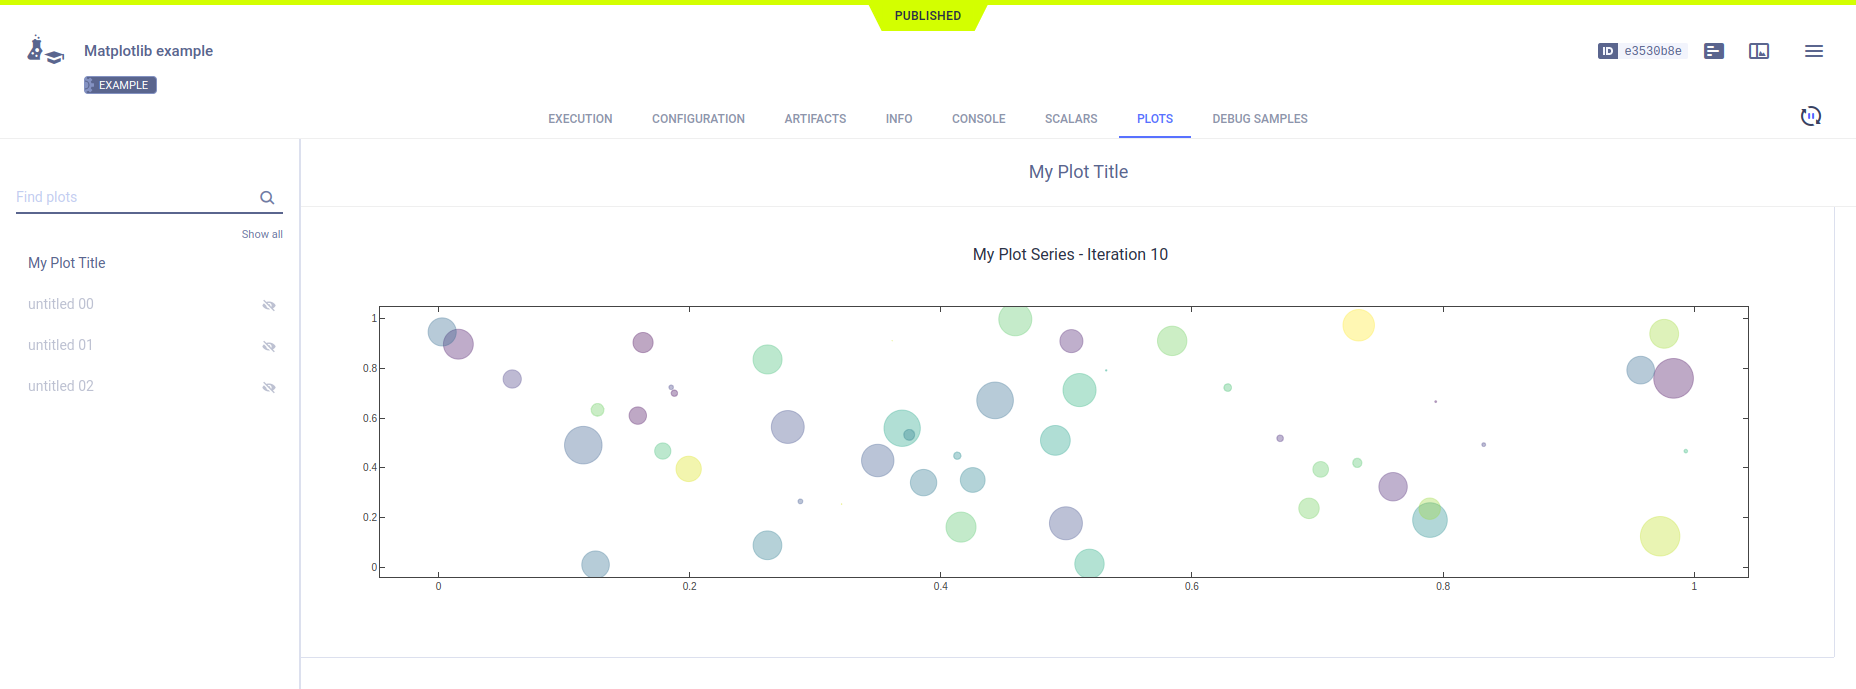 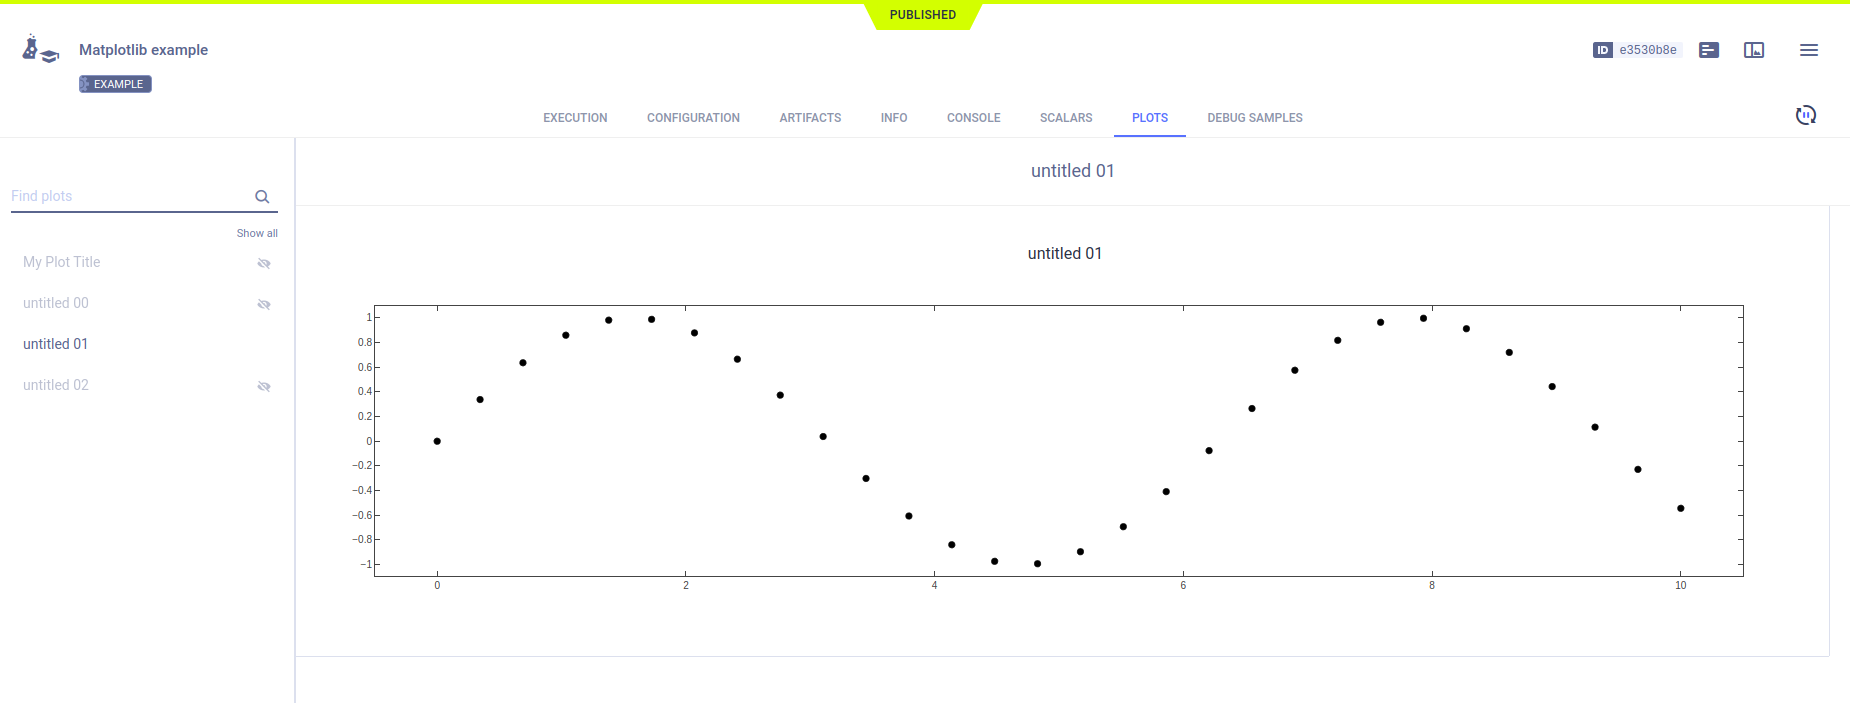 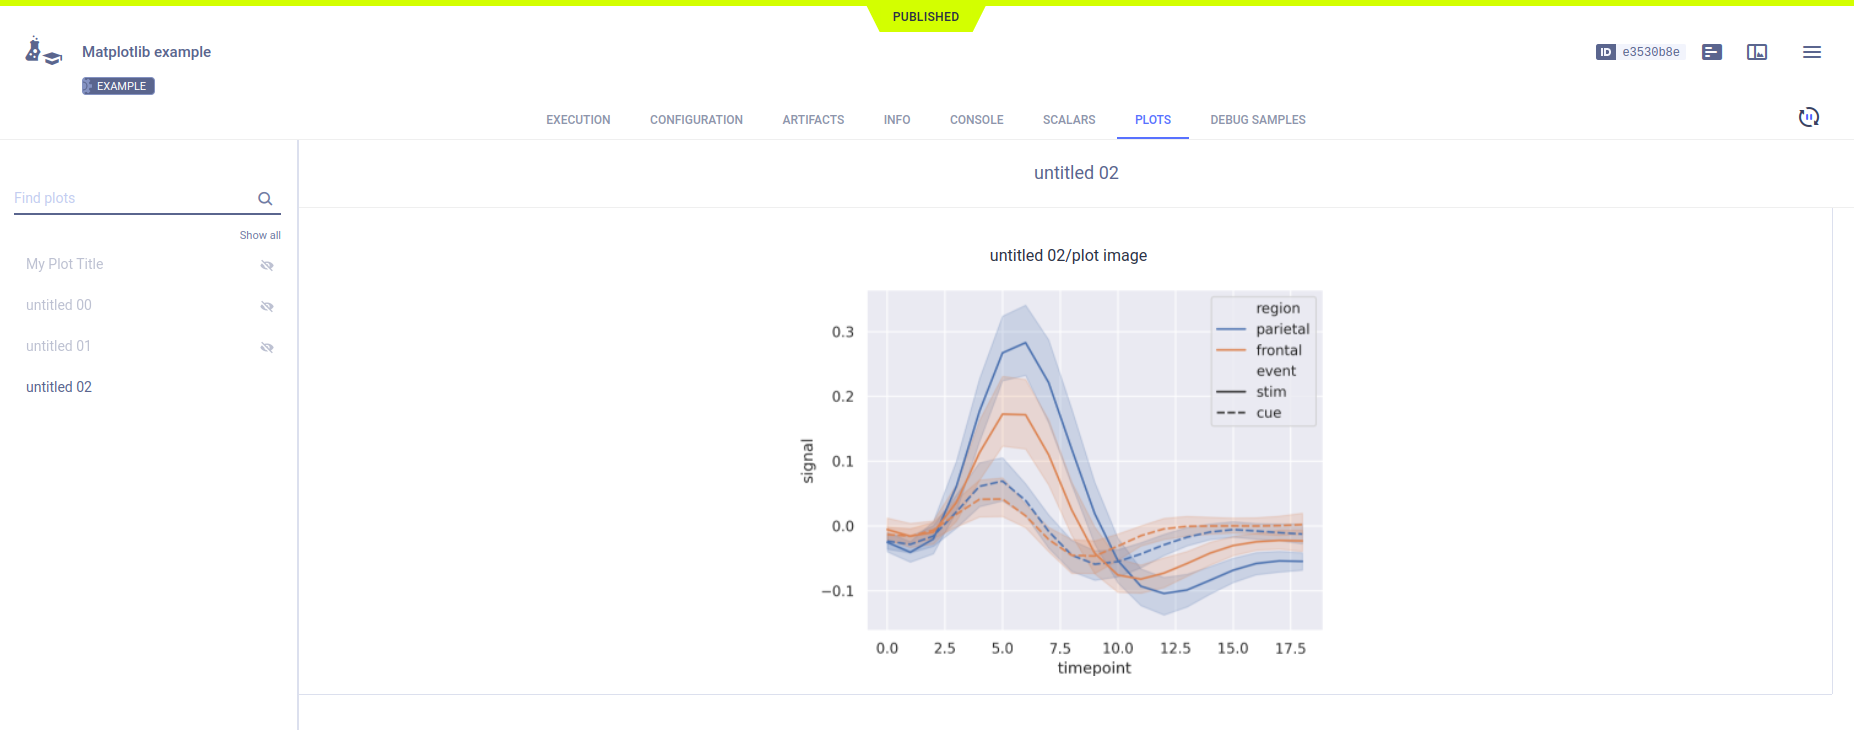 ## Debug Samples The images appear in **DEBUG SAMPLES**. Each debug sample image is associated with a metric. 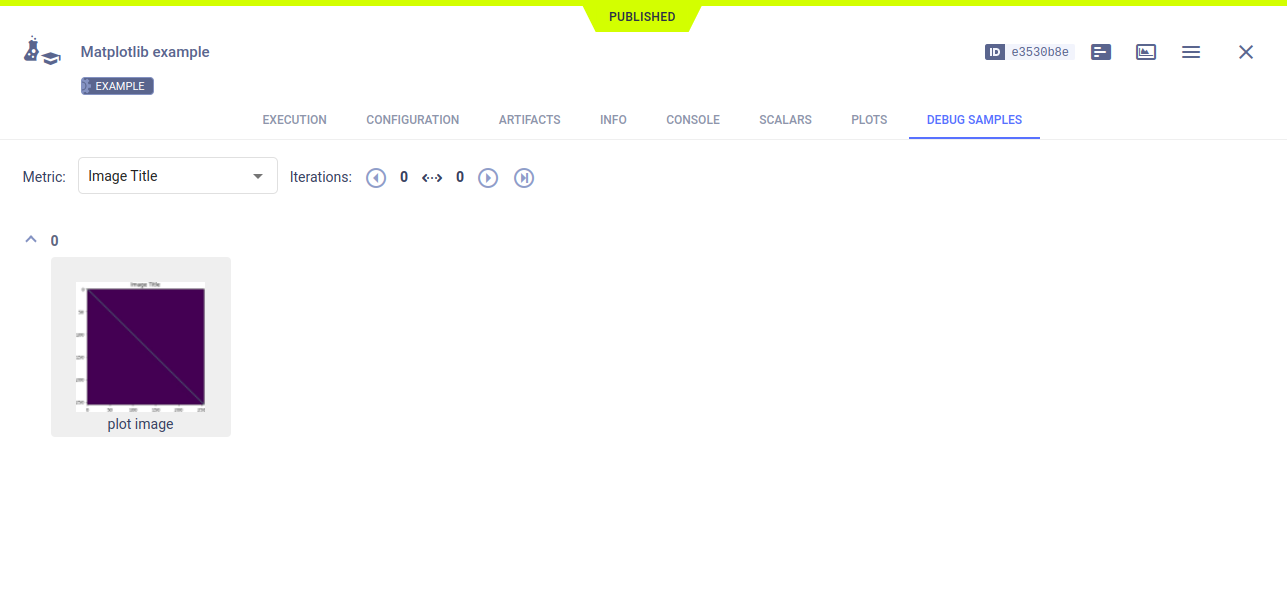 View the debug sample in the image viewer.