---
title: Scalars Reporting
---
The [scalar_reporting.py](https://github.com/clearml/clearml/blob/master/examples/reporting/scalar_reporting.py) script
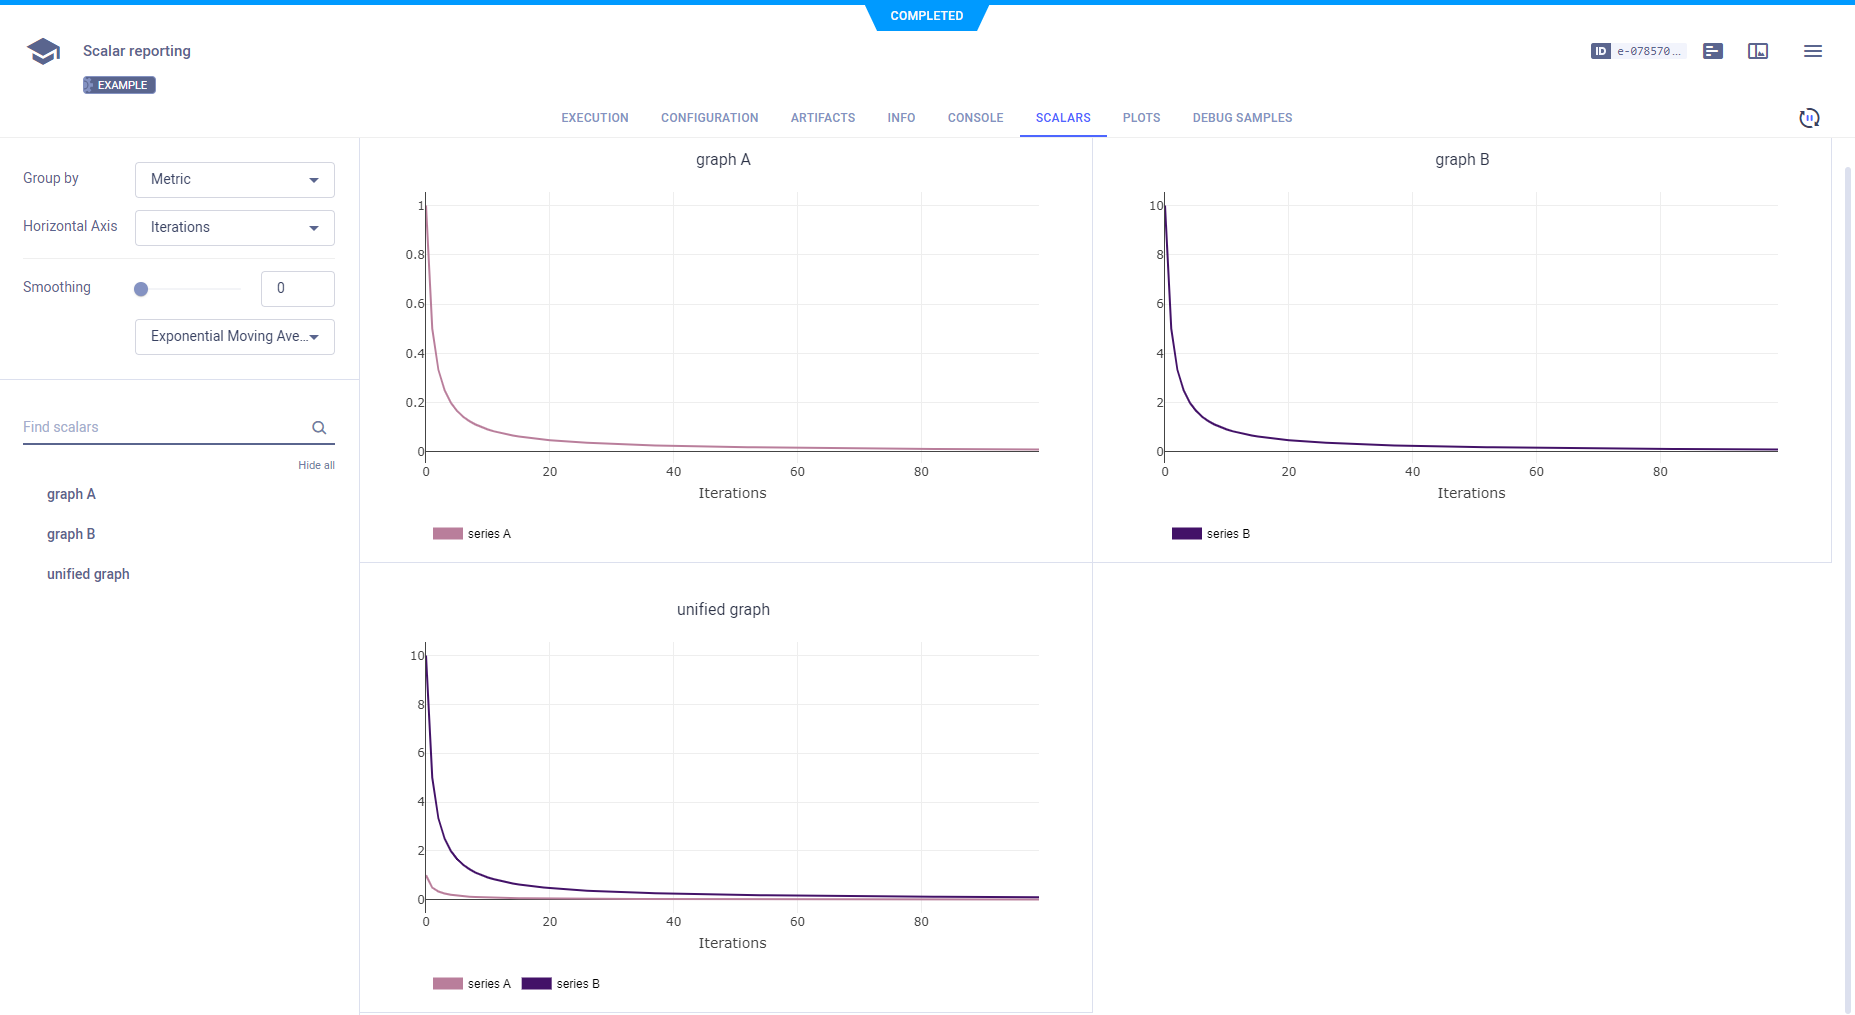
demonstrates explicit scalar reporting. ClearML reports scalars in the **ClearML Web UI** **>** task's **SCALARS** tab.
When the script runs, it creates a task named `scalar reporting` in the `examples` project.
To reports scalars, call [`Logger.report_scalar()`](../../references/sdk/logger.md#report_scalar).
To report more than one series on the same plot, use the same `title` argument. For different plots, use different
`title` arguments.
```python
# report two scalar series on the same graph
for i in range(100):
Logger.current_logger().report_scalar(
title="unified graph", series="series A", iteration=i, value=1./(i+1)
)
Logger.current_logger().report_scalar(
title="unified graph", series="series B", iteration=i, value=10./(i+1)
)
# report two scalar series on two different graphs
for i in range(100):
Logger.current_logger().report_scalar(
title="graph A", series="series A", iteration=i, value=1./(i+1)
)
Logger.current_logger().report_scalar(
title="graph B", series="series B", iteration=i, value=10./(i+1)
)
```