--- title: Model Endpoints --- The Model Endpoint table lists all currently live (active, and being brought up) model endpoints, allowing you to view endpoint details and monitor status over time. Whenever you deploy a model through the [ClearML Deploy UI applications](applications/apps_overview.md#deploy), it will be listed in the table. View the model endpoints in table view <img src="/docs/latest/icons/ico-table-view.svg" alt="Table view" className="icon size-md space-sm" /> or in details view <img src="/docs/latest/icons/ico-split-view.svg" alt="Details view" className="icon size-md space-sm" /> using the buttons on the top left of the page. Use the table view for a comparative view of your endpoints according to columns of interest. Use the details view to access a selected endpoint's details. Details view can also be accessed by double-clicking a specific endpoint in the table view to open its details view. Download the model endpoint table as a CSV file by clicking **Download** <img src="/docs/latest/icons/ico-download.svg" alt="Download" className="icon size-md space-sm" />. ## Endpoint Tables Active Endpoints are displayed in the **Active** tab. The table provides the following information: * Endpoint - Endpoint name * Model - Model Name * URL - Endpoint URL * \# Instances - Number of model instances * Uptime - Longest duration that any of the model instances has been running * \# Requests - Total number of requests to the endpoint * Requests / MIN (avg) - Average request rate in the last minute * Latency (avg) - Average endpoint response latency 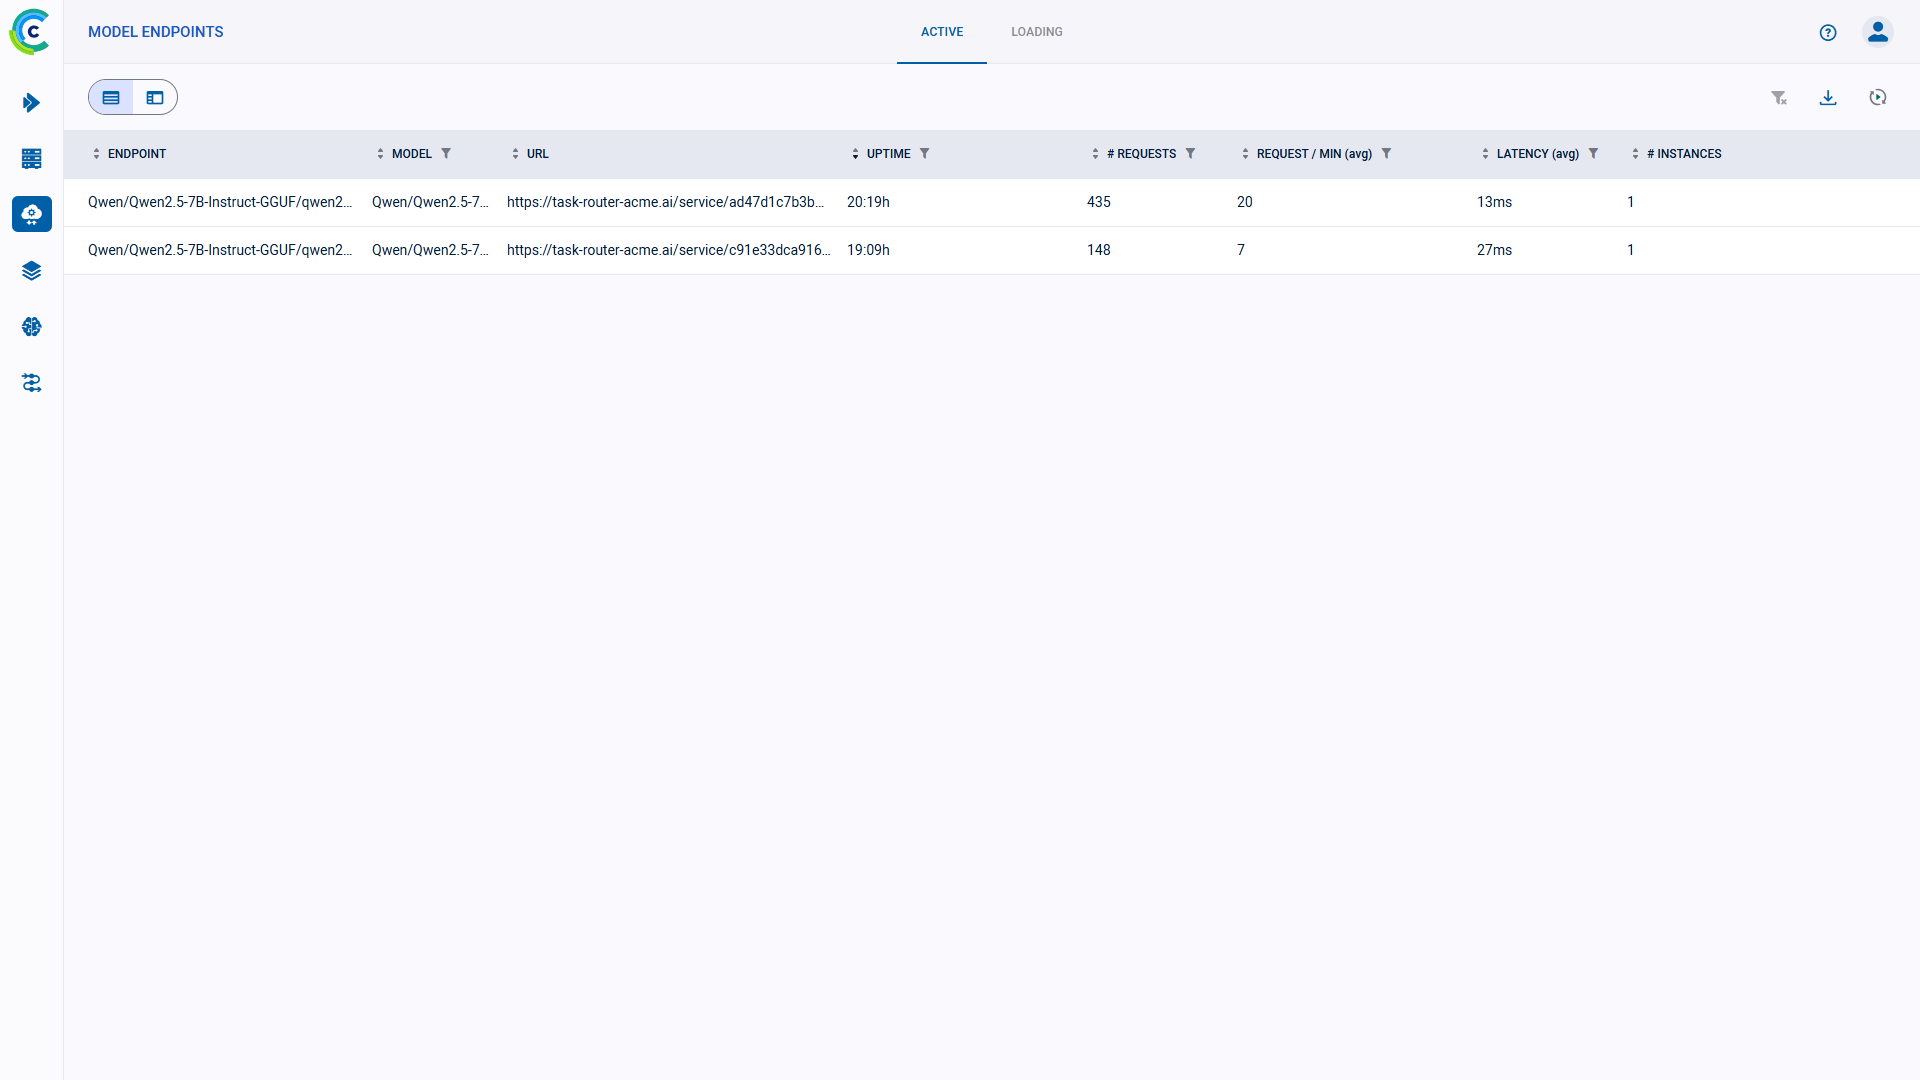  The **Loading** tab shows endpoints that are being set up, but are not yet active. The table provides the following information: * Instance ID - The model deployment application instance ID * Model - Model Name * Uptime - Time since this endpoint has started setting up * Preprocess artifact - Preprocessing code used for the endpoint * Input type - Model matrix input type (e.g. uint8, float32, int16, float16) * Input size - Model matrix input size   You can apply column filters by clicking <img src="/docs/latest/icons/ico-filter-off.svg" alt="Filter" className="icon size-md" />, and sort endpoints by clicking <img src="/docs/latest/icons/ico-sort-off.svg" alt="Sort order" className="icon size-md space-sm" /> on the relevant column. ## Active Endpoint Details Clicking on a model endpoint opens it in detailed view. ### Details The **Details** tab displays the model endpoint information: * Endpoint Name * Endpoint URL * Model name (click to go to ClearML or HuggingFace model page) * Uptime - Duration of longest running endpoint instance * Preprocess artifact - Preprocessing code used for the endpoint * Input type - Model matrix input type (e.g. uint8, float32, int16, float16) * Input size - Model matrix input size * Model instances list - Model instances servicing the endpoint. The following information is displayed for each instance: * Instance ID - Click instance ID to go to the model endpoint's ClearML Application instance dashboard . * Uptime * Number of requests - Total count * Request rate - Average requests per minute * CPU Count * GPU Count * Latency - Average request latency in the last minute 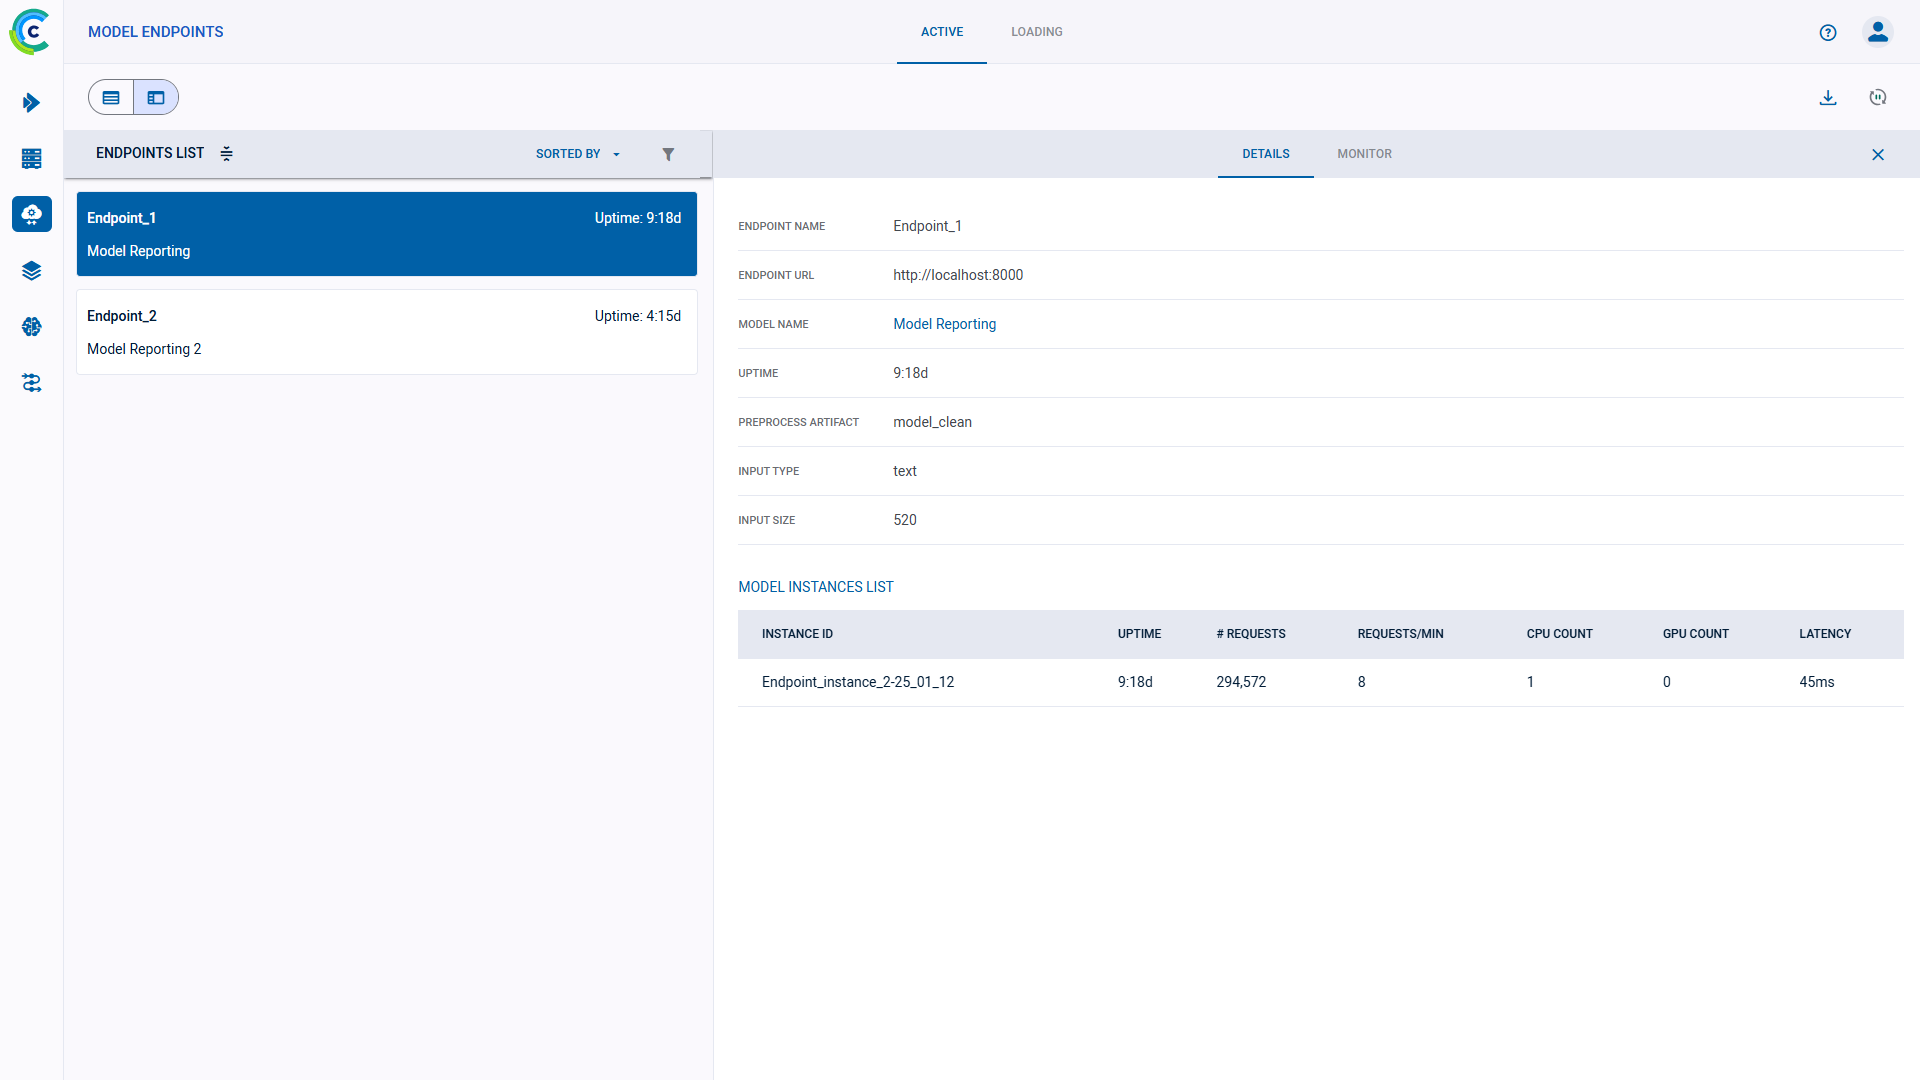 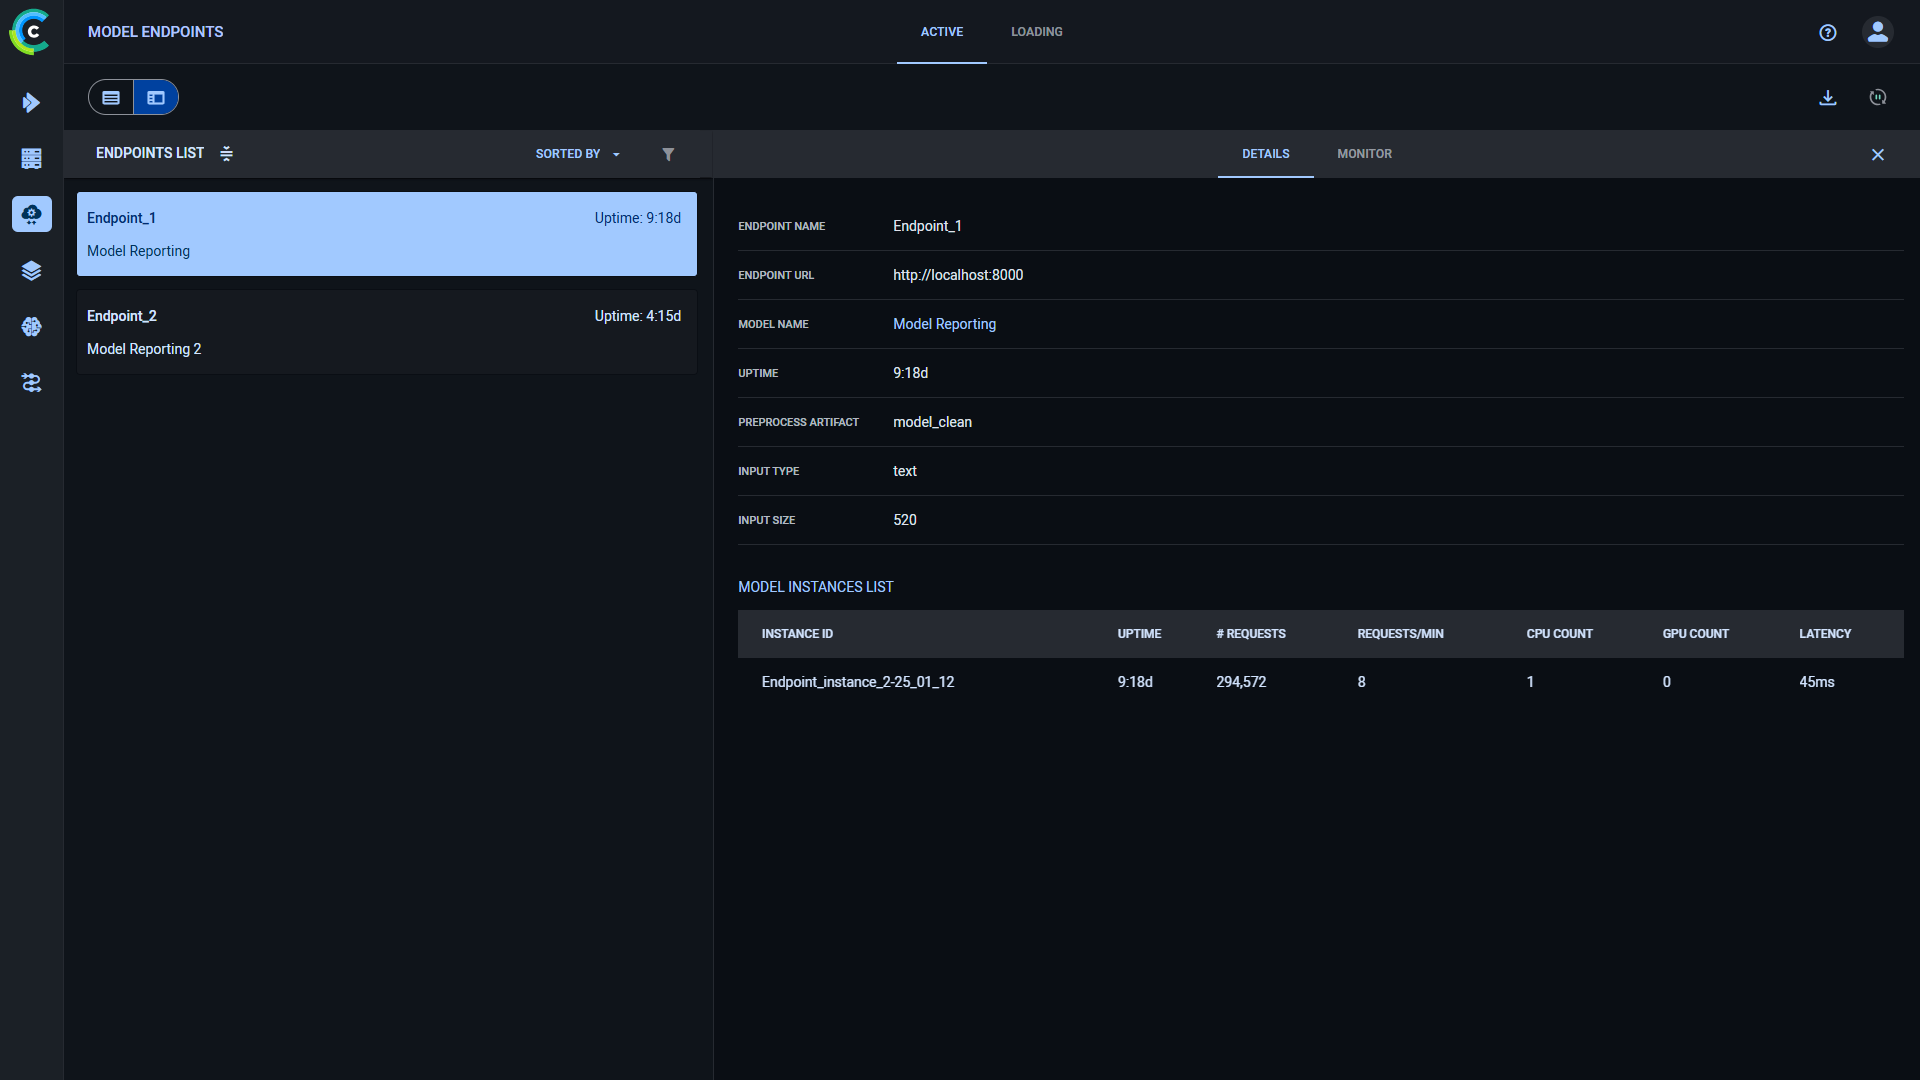 ### Monitor The Monitor tab displays the endpoint's operational metrics and resource usage over time graphs: * Total number of requests * Average requests/min * Average latency * Machine utilization metrics: * CPU and GPU Usage * Memory Usage * Video Memory Usage * Network Usage  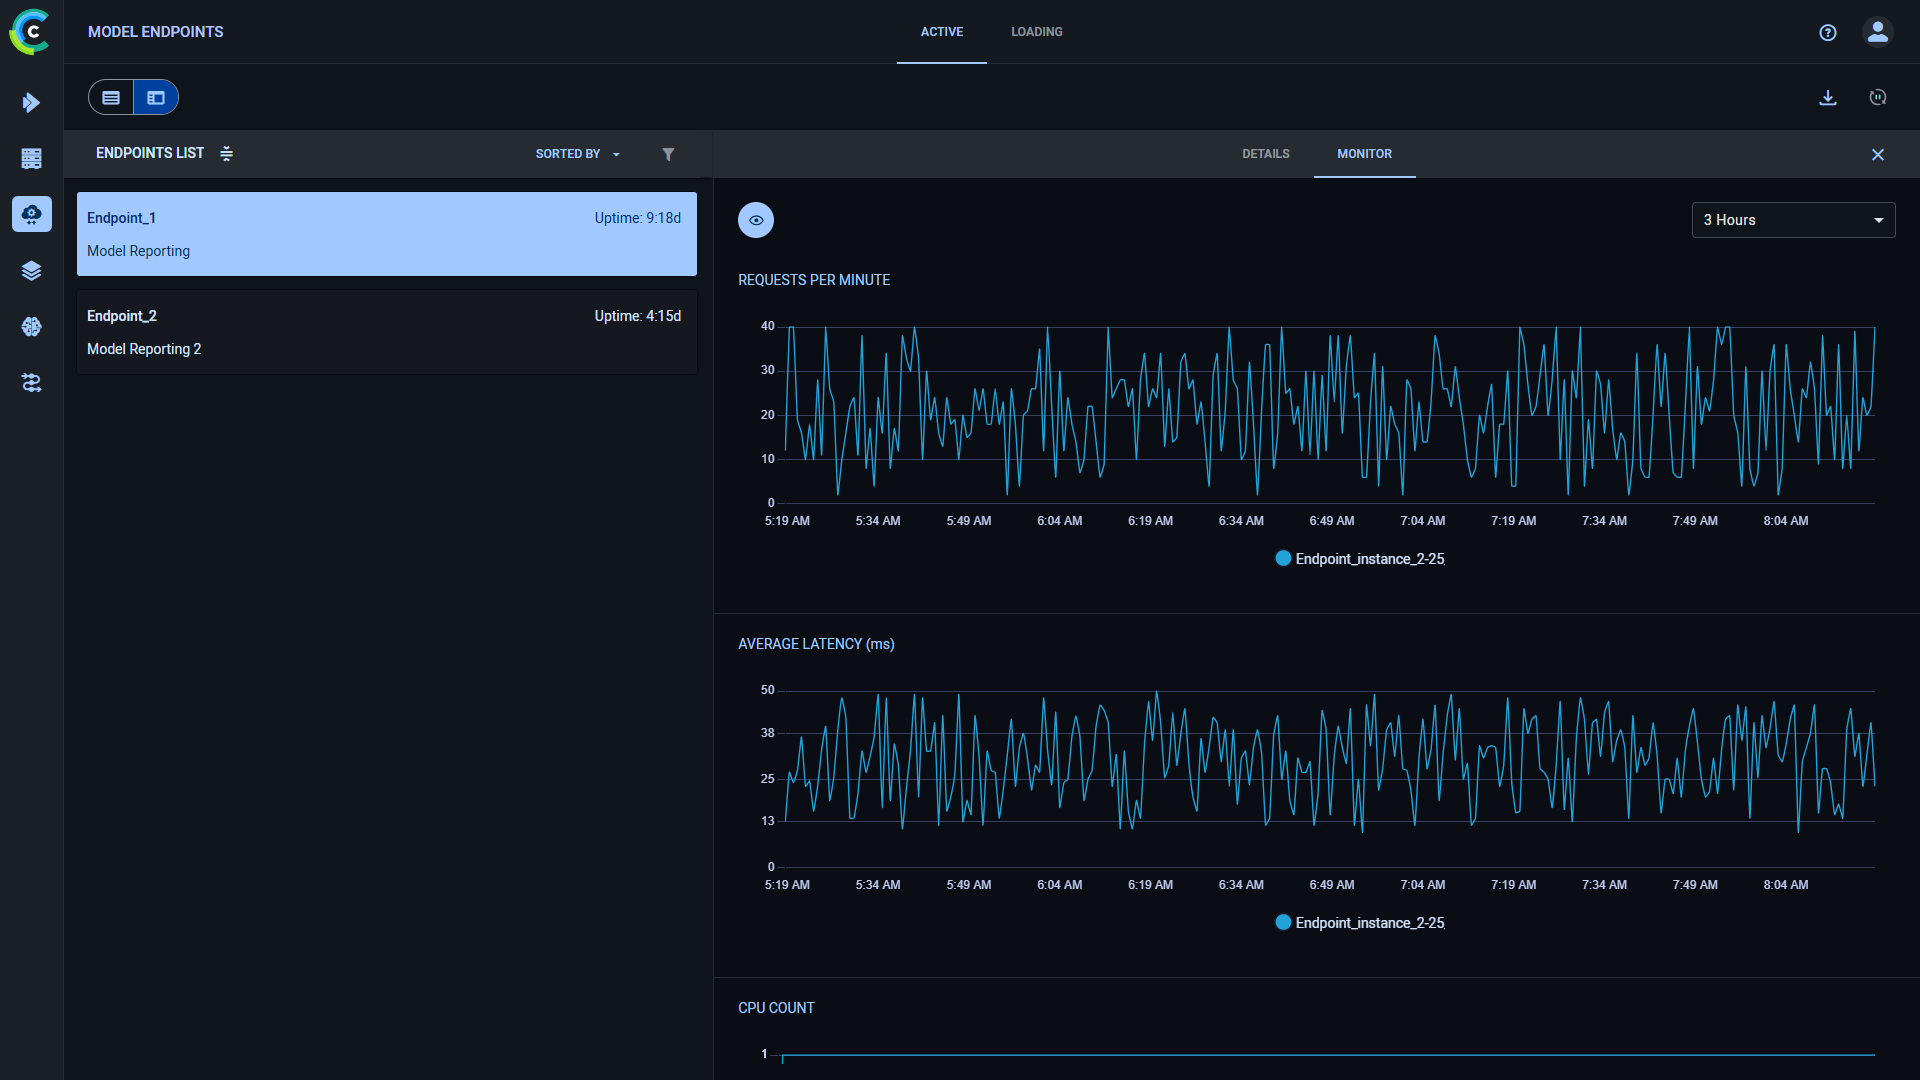 The graphs' time span can be controlled through the menu at its top right corner. Click <img src="/docs/latest/icons/ico-show.svg" alt="Eye Show" className="icon size-md space-sm" /> to control which plots to display. For example, to display specific plots, click **HIDE ALL**, and then click <img src="/docs/latest/icons/ico-show.svg" alt="Eye Show" className="icon size-md space-sm" /> on each plot you want to view.